 to open the STAT menu.
Then press
to open the STAT menu.
Then press to open the Edit... option.
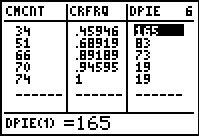
| Value | Frequency | Degrees |
| 732 | 34 | 165° |
| 733 | 17 | 83° |
| 734 | 15 | 73° |
| 735 | 4 | 19° |
| 736 | 4 | 19° |
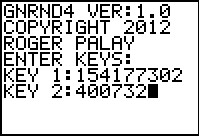
We need to start with some data. We will generate a list of data on the calculator using GNRND4 with Key 1=154177302 and Key 2=400732. That list will be the same numbers that appear in the following table: Thus, our problem will be to generate a Pie chart for the data in the list above.
Before we tackle the exact values here, let us recall that what we need to do is
The really good news here is that COLLATE2 does all of the work, except drawing the chart, for us.
|
| We start GNRND4 and give it the required key values. | ||||||||||||||||||
|
|
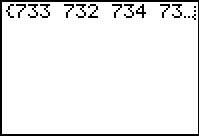
The program produces the values as shown above, and it places those values into L1. | ||||||||||||||||||
|
|
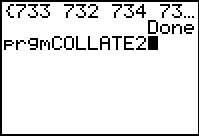
We end the program and select the COLLATE2 program. | ||||||||||||||||||
|
|
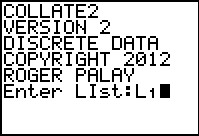
The program starts and we give it the location of the input data, namely, L1. | ||||||||||||||||||
|
|
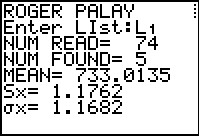
The program produces some display output. We note that there are 5 different values found so our pie will have 5 pieces. Also, we see that there are 74 total entries. If we were to have to do some hand calculations later we would want to know this number. | ||||||||||||||||||
|
|
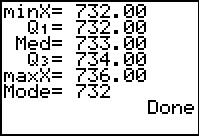
This is a second page of the display output. Note that we finish the program before we go on. The next step will be to look at the lists that the program produces. | ||||||||||||||||||
|
|
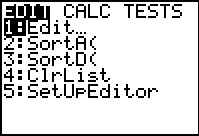
Press to open the STAT menu.
Then press to open the Edit... option.
| ||||||||||||||||||
|
|
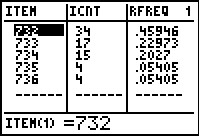
Figure 8 shows us the first lists in the editor. We are interested in these since they give the different valeus found, in this case 732, 733, 734, 735, and 736. It is nice to see the frequency with which these appear. If we had to do any hand calculation we would need to use these frequencies. in particular, to find the number of degrees to allocate to the 734 piece of the pie, we would calculate 360*15/74, where the 74 was the total of all the values in LICNT, and it is the number that we observed in Figure 5. | ||||||||||||||||||
|
|
Fortunately, we do not need to do any of that since the
COLLATE2 program provided us with a list that has
the results of all of those computations.
We just need to move to the right in the display to find the
LDPIE list. It holds the number of degrees that we should assign to
each piecce. We could put the information of Figures 8 and 9 into our own little table
to get
|
©Roger M. Palay
Saline, MI 48176
September, 2012