Inequalities

Return to Module 0 page

We have five different statements of inequality:
SymbolMeaningAlternate Keyboard Symbols
<less than<
less than or equal to< =
>greater than>
greater than or equal to> =
not equal!= or < >
We use those symbols to describe the relative value of two quantities. For example we write 34 < 78 because 34 has a smaller value than does 78. Another way to look at that is to note that on a number line 34 is to the left of 78.
We could have expressed the same relationship between 34 and 78 by writing 78 > 34, saying that 78 has a greater value than does 34.

As another example, look at − 25 < 8, again noting that − 25 is to the left of 8.
Of course, this same less than or greater than relation holds for small magnitude numbers. We write 0.0416 > 0.025, or, equivalently, 0.025 < 0.0416, as illustrated on the number line as

Thus far we have seen examples of < andd >. The statement 34 < 78 is also true, as is 78 ≥ 34. Even the statements 34 ≤ 34 and 34 ≥ 34 are true, although they seem rather weak. Rounding out our inequality options the statement 78 ≠ 34 is also valid, although it does not tell us much about the two values.

Inequalities are much more useful when we use them with variables. For example, using the variable p, the statement p < 34 tells us that p is some number that is less than 34. We may not know the actual value of p, but we can be sure that it is less than 34. We would graph p < 34 as
The red portion of the graph indicates all of the possible values for p. Also note that we indicate that the value 34 is not part of the possible values by putting an open circle at 34.

Similarly, for the variable a we might find that a ≥ 12.6. In that case, the value of a is something greater than or equal to 12.6.
Note that the filled circle at 12.6, 
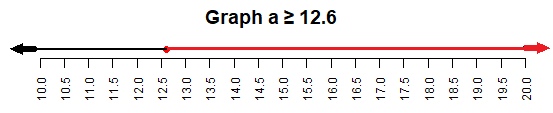
, indicates that 12.6 is a possible value for a ≥ 12.6.

For variable s, the statement s ≠ 4.75 just tells us that the value of s is something other than 4.75.
Note that the open circle at 4.75, 
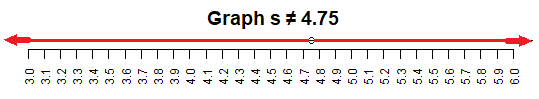
, indicates that 4.75 is not a possible value for s ≠ 4.75.

The last three examples, where we use a variable in our inequality, have graphs of the solution that extend to the left or to the right or, as in the last case, both left and right. Consider the following graph:
Here we are looking at values that are strictly between 4 and 7. The strrictly aspect means that neither 4 nor 7 satisfy our compund inequality t>4 AND t<7. Our solution, the numbers in the red area, must satisfy both parts of the compound inequalty. That is, those are the values that are greater than 4 and, at the same time, less than 7.

We have a short-cut way to specify the compound inequality used above. We can write 4 < t < 7 to say t>4 AND t<7.

Using that model, consider 14 ≤ w ≤ 27.
Note that we use closed circles at 14 and 27 to indicate that those values are part of the solution. Typically we say that we want values between 14 and 27, inclusive. The inclusive tells us that the two extremes are part of the solution.

We need to take an extra moment to point out that there is an alternative scheme for describing compound inequalities. We could write 4 < t < 7 as (4,7), an interval that goes from 4 to 7, but does not include either 4 or 7. The parentheses indicate that this interval is strictly between the two extremes. If we want to include the extremes then we use brackets. Therefore, we could write 14 ≤ w ≤ 27 as [14,27], where the brackets indicate that the extremes are in the solution.

Return to Module 0 page
©Roger M. Palay     Saline, MI 48176     December, 2022