Automating Values from Grouped Data
Return to Topics page
In the previous page,
Getting Measures from Grouped Data, we walked through processes
to find values such as the approximate mean and standard deviation
from data that is presented in a frequency table of intervals (bins).
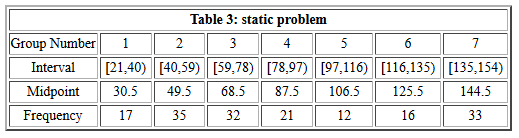
An example of this situation was given by the table:
Figure 1
The approach that we took involved
- creating
a list of the midpoints of the intervals
- creating a list of the frequencies
of the intervals
- creating a new valiable
that had each midpoint value repeated the frequency number of times.
This process could be used to
solve any similar problem.
The process never changes. The only change that
we have from problem to problem is that we have different
low and high points for the intervals,
a different number of intervals,
and different frequencies for each interval.
Because the steps that we take to solve the problem
never change we can capture those steps in a function.
When we set out to design such a function
we need to determine what values we need to give to the
function. Clearly, the frequencies change for each problem and even
the number of intervals will change.
Also, the low and high ends of each interval change.
However, the number of intervals is always equal to the number of
frequencies.
Thus, if we know the number of frequencies we also know the
number of intervals.
In our problems it is always the case that the intervals are of
a uniform width, that is, if the first interval is
15 units wide then all of the intervals in that problem are
15 units wide.
Therefore, if we know the width of the first interval then we know
the width of all the intervals.
But all we need to find the width of the first interval is the
low and high value for that interval.
This means that for the problem shown in Figure 1 above, all of the
data for the problem is determined by knowing
-
that the first interval starts at 21
- that the first interval
ends at 40, and
- that the list of frequencies is
17, 35, 32, 21, 12, 16, 33
From just that information we could construct the rest of Table 3 given in Figure 1.
The function get_from_table() uses that kind of information to
produce a few values, and as a side benefit, to create a variable
that holds each of the interval midpoints the number of times
given by the interval frequency.
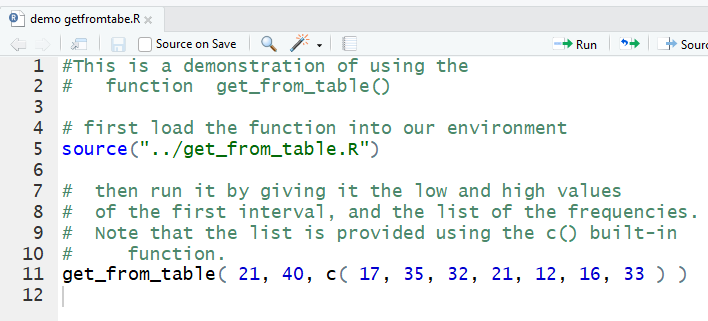
Figure 2 shows the command to put the
function into our environment (line 5) and then to run it
with the information given in Figure 1 (line 11). (This does assume that we are
running these commands from the subdirectory of the folder that holds all of
our functions.)
Figure 2
The result of running the commands of Figure 2 are shown in
Figure 3.
Figure 3
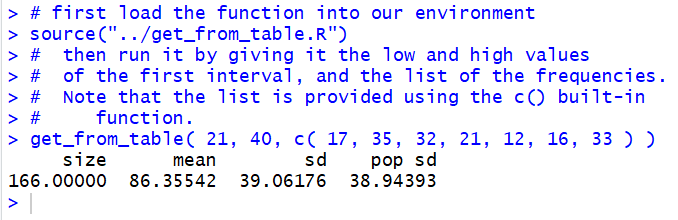
We see that get_from_table()
gives us the number of items given by the frequencies of Table 3
(in this case 166), the approximate mean of the values (86.35542)
derived as we had done previously from using the midpoints,
the standard deviation if this is a sample (39.06176), and the standard deviation
if this is a population (38.94393). In addition, although not shown in the output,
get_from_table() leaves the created list of midpoint values in a
variable called from_table_x. We can see that the variable is
there by looking at the environment area, shown in Figure 4.
Figure 4
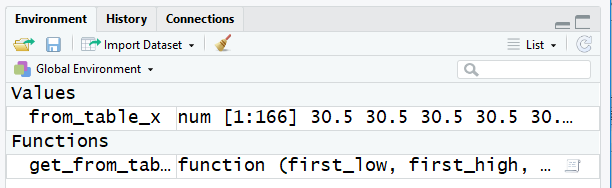
Figure 5 shows the result of looking
at from_table_x.
Figure 5
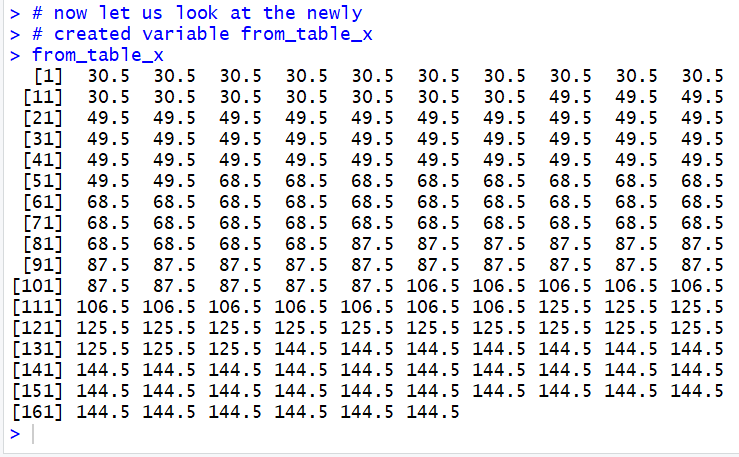
Thus we see that 30.5 is the midpoint of the first interval and that
the variable from_table_x does hold
21 of those values. After those values, from_table_x
holds 40 of the next midpoint, namely 49.5, and so on.
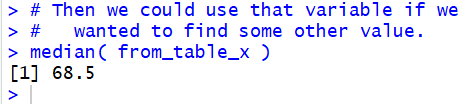
Because we have access to from_table_x
we can use it in further computations, such as to find the median
of the values. This is shown in Figure 6.
Figure 6
It is worth checking all of these results against the
values that we worked out, step by step, back in the previous
page,
Getting Measures from Grouped Data.
Return to Topics page
©Roger M. Palay
Saline, MI 48176 January, 2025