Test for Comparing Means of Two Populations, Sigmas Known
Return to Two Samples: Sigma's Known
This page works through one of the sets of problems, cases 11 through 17,
from the page that introduces confidence intervals and tests for the
difference of the means between two populations when we know the standard
deviation of each of the populations.
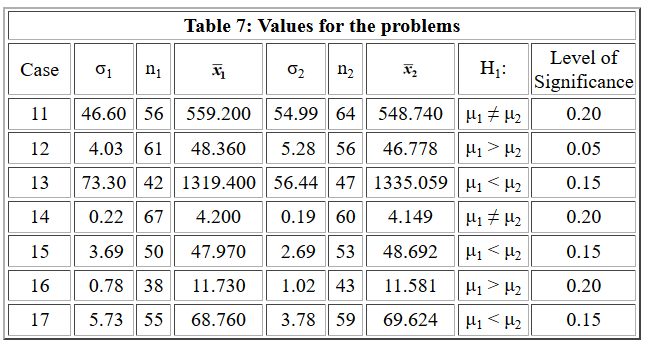
We start out with the probem statements captured below in Figure 1
Figure 1

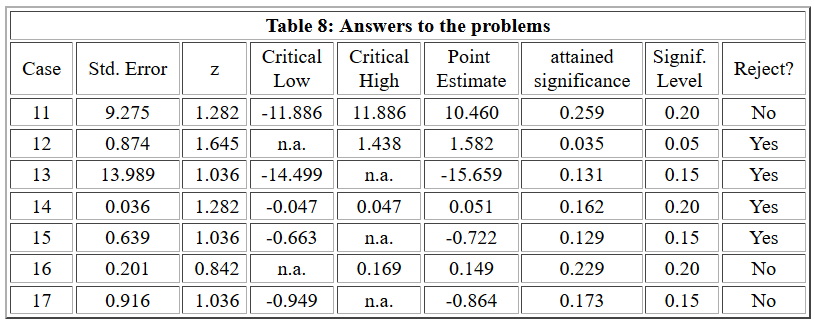
Then, on that same web page, we are given a table of the answers for each of those
cases. That is shown in Figure 2.
Figure 2

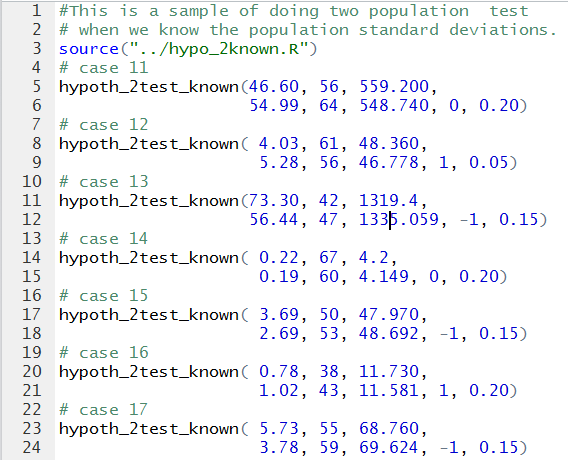
To do these problems we start an RStudio session and we create the commands
shown in Figure 3.
Figure 3

Just so that you can, if you wish, copy those commands and paste them into
your own RStudio session, they are repeated here:
#This is a sample of doing two population  test
# when we know the population standard deviations.
source("../hypo_2known.R")
# case 11
hypoth_2test_known(46.60, 56, 559.200,
                   54.99, 64, 548.740, 0, 0.20)
# case 12
hypoth_2test_known( 4.03, 61, 48.360,
                    5.28, 56, 46.778, 1, 0.05)
# case 13
hypoth_2test_known(73.30, 42, 1319.4,
                   56.44, 47, 1335.059, -1, 0.15)
# case 14
hypoth_2test_known( 0.22, 67, 4.2,
                    0.19, 60, 4.149, 0, 0.20)
# case 15
hypoth_2test_known( 3.69, 50, 47.970,
                    2.69, 53, 48.692, -1, 0.15)
# case 16
hypoth_2test_known( 0.78, 38, 11.730,
                    1.02, 43, 11.581, 1, 0.20)
# case 17
hypoth_2test_known( 5.73, 55, 68.760,
                    3.78, 59, 69.624, -1, 0.15)
Of course, we need to load the hypoth_2test_known
function. After that is done we will execute each of the commands to obtain the 7
following Figures. In each case, the answers generated in the RStudio session
correspond to the answers given in Table 8, shown above in Table 2.
Figure 4: Case 11

Figure 5: Case 12

Figure 6: Case 13

Figure 7: Case 14

<Figure 8: Case 15

Figure 9: Case 16

Figure 10: Case 17

Return to Two Samples: Sigma's Known
©Roger M. Palay
Saline, MI 48176 November, 2016


