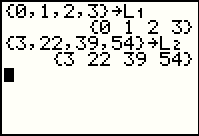

| First, we will put the associated values from the chart on page 41 of the text into lists L1 and L2. |

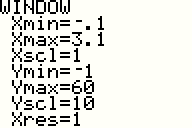
| Then we will set the window so that we can see such points. The goal here is to get a graph similar to Figure 3(a) on page 45. |

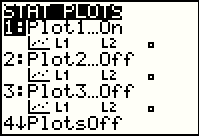
| Then, using the STAT PLOT window we make sure that we are plotting L1 and L2. |

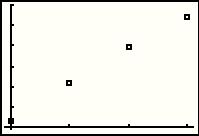
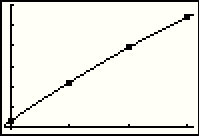
| Having set up all of that we can GRAPH the points. This does indeed look like Figure 3(a). |

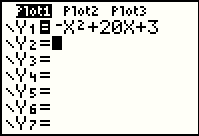
| Using the Y= screen, we enter the proposed function,
|

| Returning to the GRAPH screen we get this image, which corresponds to Figure 3(b) on page 45 of the text.
All seems good, but consider a different model, namely
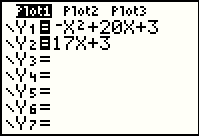
|

| We return to the Y= screen and enter the new model. |

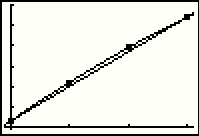
| Going back to the GRAPH screen we see that the new graph is really close tot he original one. It does not hit all of the points but it is not far off. [And, in reality, there is little likelihood that Apple actually sold exactly 3,000,000 iPods in 2004, and exactly 22,000,000 in 2005, and so on. The original function was at best an approximation and our new one is just as good in that case.) |

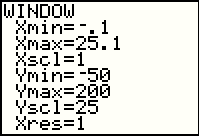
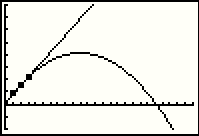
| The difference in the two models becomes more clear if we expand our window. Here we have returned to the WINDOW screen and changed a number of the settings. |

| Now we can see that the original proposal, if extended for more years ends up with Apple selling a negative number of iPods, somewhere around 2024. This makes no sense. Of course, or more simple model has its own problems in that it predicts an ever increasing sale of iPods, and by year 20, i.e., 2024, that model would have the sales at 343 million iPods for that year. The issue here is not that the alternative model is better. Rather, the issues are that there is no reason to have the more complex model, neither model seems satisfactory in the long run, and, for the sake of clarity, although quadratic models always have the shape of a parabola, within a short span of the domain there is a good linear approximation to the quadratic model. |
©Roger M. Palay
Saline, MI 48176
August, 2010