Worksheet 03: Descriptive Measures
Return to Topics page
Here is the story!
I wanted us to have some real data to use for this example.
So, in my copious free time I went for a walk and looked for something that I could
bring back to the class.
Standing along Platt Road in Ann Arbor, just south of the intersection with
Washtenaw Avenue, I observed that the northbound cars on Platt
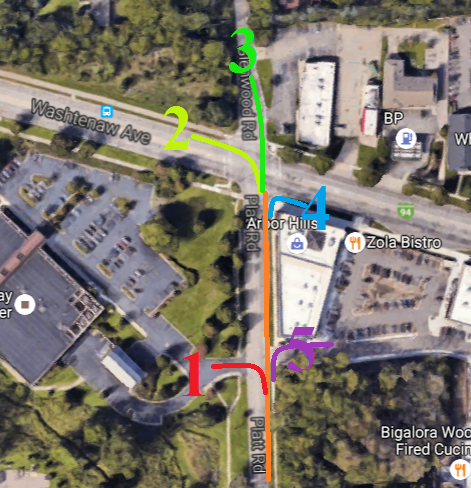
made one of five choices ahead of me:
- turn into the Washtenaw County Rec Center,
- make a left turn onto Washtenaw (westbound),
- cross the street and continue onto
Glenwood,
- make a right turn onto Washtenaw (eastbound), or
- turn right into the Arbor Hills shopping center.
This is shown in Image 1.
Image 1
I decided to make a short study of the number of cars making each choice.
I assigned numbers to each choice (1=Rec Center, 2=west on Washtenaw, 3=onto Glenwood,
4=east on Washtenaw, and 5=shopping center).
As each car came up the road I wrote down the choice for that car. Thus, I generated a
collection of 98 values.
Here is the record of the
first 98 cars that I saw coming up Platt.
I want to get a feel for this data. just looking at the values in
Table 1 does not help. I need some descriptive measures of this
data.
I decide to use R to do this work.
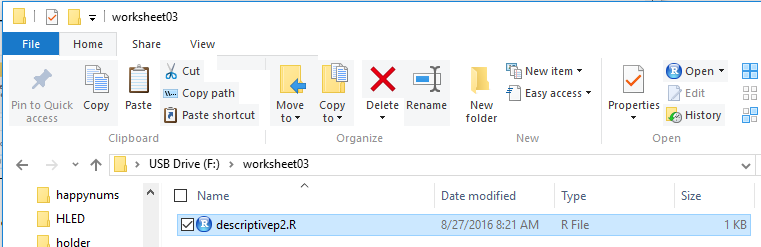
I create a new folder (directory) on my USB drive, rename it, copy
the model.R file to it, and then rename that file, in this case to
descriptivep2.R. That is shown in Figure 1.
Figure 1
I double click on the descriptivep2.R file name to open
my RStudio session.
Then I need to get the data from Table 1 into my RStudio session.
Thankfully, there is a setting for the gnrnd4 function
that will produce exactly those values!
|
[Disclaimer: I sure hope that you realize that
this whole story is bogus. I coud have actually stood out there and found the real
values but then we would
have had to find a way to get the values to you so that you could read them into
your RStudio session. Instead, I generated the table using gnrnd4 on my
machine and then I reported the numbers as if I had actually observed them.]
|
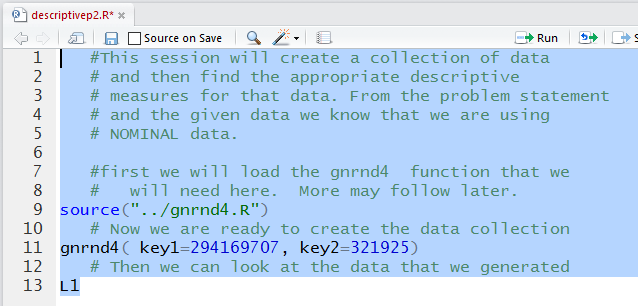
Therefore, I wrote the comments and commands shown in Figure 2.
Figure 2
Running the highlighted lines produced the
output shown in Figure 3 in the Console pane.
Figure 3
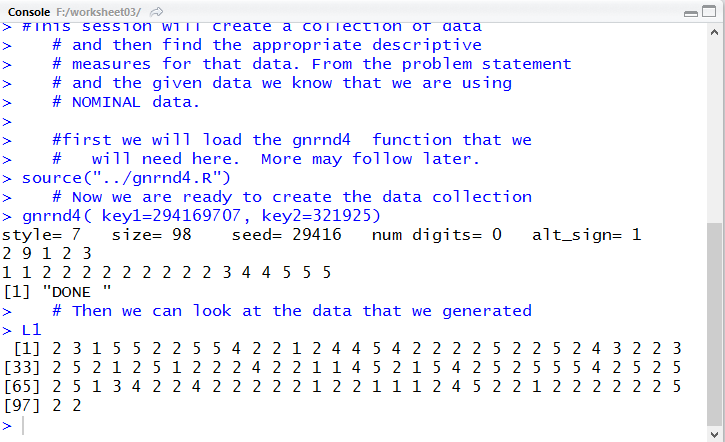
A quick check of the values shown in Figure 3 against the values in
Table 1 shows that we do indeed have the correct values.
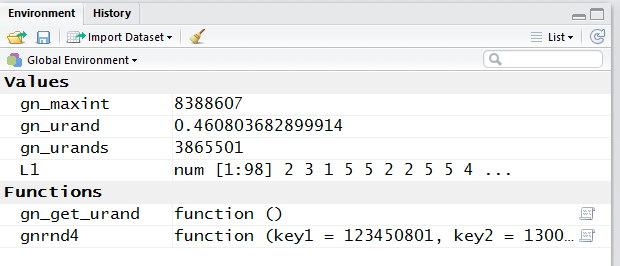
A look at the Environment tab, shown in Figure 4,
further confirms that the commands did what we wanted done.
We can even see that there are indeed 98 values in L1.
Figure 4
I know that the data in L1 is nominal data.
The values, 1 2, 3, 4, and 5 are merely names for the choices
that the drivers made. Those values are not measurements.
I could have assigned different values to each of the choices.
There is no underlying order to the choices.
Therefore it makes no sense to compute the mean,
median, quartiles, or even the range for these values.
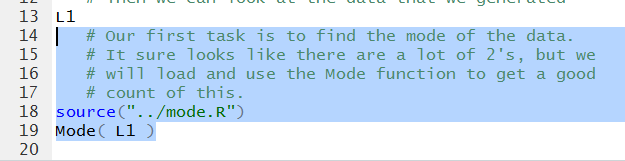
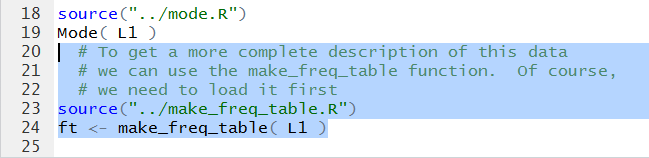
What would be helpful is to know the mode of the values.
We know that we have to load the Mode function,
it is not a built-in function. That gives rise to the new lines shown in Figure 5.
Figure 5
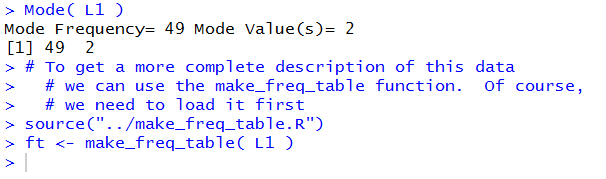
Running the hghlighted lines of Figure 5 gives us the output in
Figure 6.
Figure 6
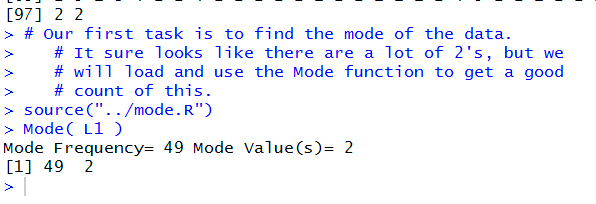
Now we know that the value 2 happened more often than did any other value
in the collection, and in fact, there are 49 2's in the table.
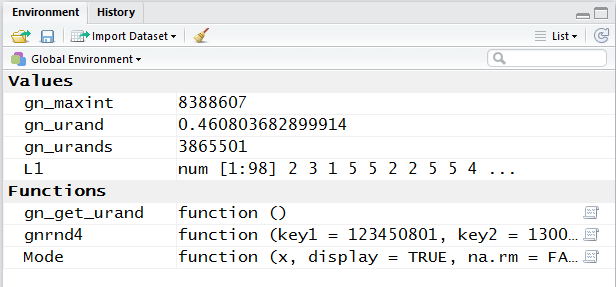
A quick glance, Figure 7,
at the Environment area confirms that the Mode
function has been loaded.
Figure 7
What would be really informative is to have a frequency table
for the data in the collection.
We recall that we have the make_freq_table function
that will make such a table. The commands in Figure 8 show
how to load and then run that function.
Figure 8
Running those lines does not produce much in the
Console pane, Figure 9.
Figure 9
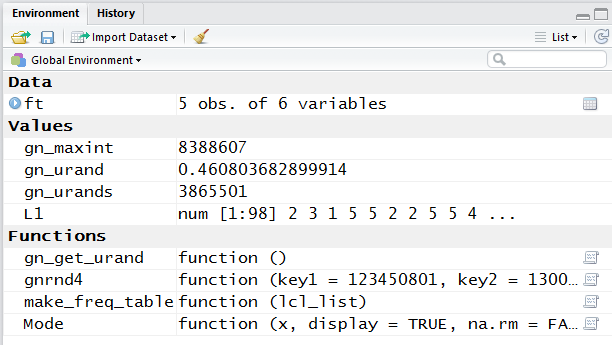
That is because we assigned the output of the make_freq_table
function to the variable ft.
Looking at the Environment pane
shows us that there is a new variable there.
Figure 10
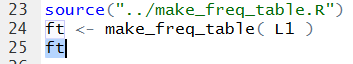
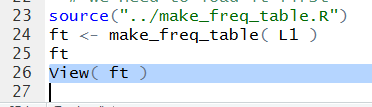
To see the contents of that variable we just need to add a line
that gives the variable name, ft as shown in Figure 11.
Figure 11
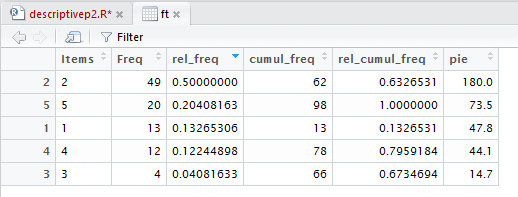
When we run that line we get the result shown in Figure 12.
Figure 12
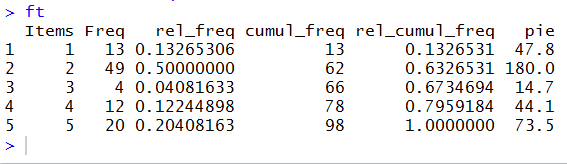
Now we have the count for each of the five alternatives,
and we even have the relative frequency of those choices.
[The cumulative values are meaningless because there
is not a real underlying order to the values.]
We even have, should we need it, the number of degrees
for the central angle for each piece of a pie
chart should we have to make such a chart.
As we have seen before, we can get a slightly more elegant version of that
table by using the View function.
The command is recorded in Figure 13.
Figure 13
Ir we run it we get very little in the
Console pane, shown in Figure 14.
Figure 14

However, we do get a new tab in the Editor pane, shown in Figure 15.
Note that the image in Figure 15 has been augmented with a green oval.
Figure 15
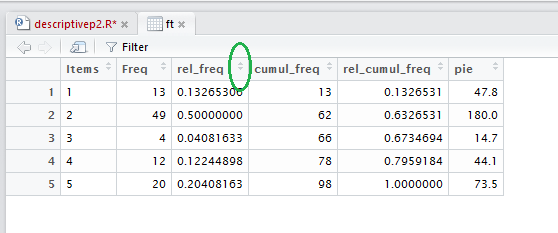
Earlier web pages have talked about the added power of the View
generated display, an example of which is in Figure 15.
If you point to and click on the area in th title bar shown in the
green oval of Figure 15 the system will sort the values in that
column and maintain values in corresponding rows.
That is how we get to Figure 16, just click on th region highlighted in Figure 15.
Figure 16
Now, in Figure 16, all of the rows have been sorted according to the
increasing value of the items in the column that we selected.
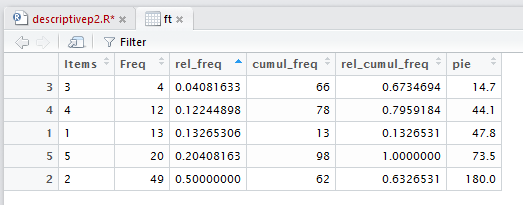
If we click on that region again we get the values sorted into decreasing order,
as shown in Figure 17.
Figure 17
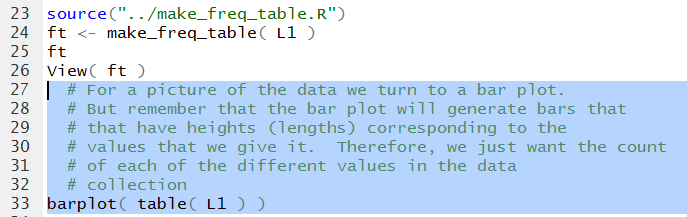
The appropriate graphic representation of the values in the data collection
is a bar plot. We recall that the barplot function
creates a bar for every value in the list that we send to it.
Thus, we would not want to use L1 as an argument
for the function. If we did we would get a plot with 98 bars!
Our goal is to have the height of the each bar represent the number of
each different value in L1.
We can use the table function to get those counts
and then pass the results of that fnction to the barplot function.
This is shown in the highlighted command in Figure 18.
Figure 18
Of course there is not much to see in the Console pane, as shown in
Figure 19.
Figure 19
However, the barplot function creates a graph in the
Plots tab, shown in Figure 20.
Figure 20
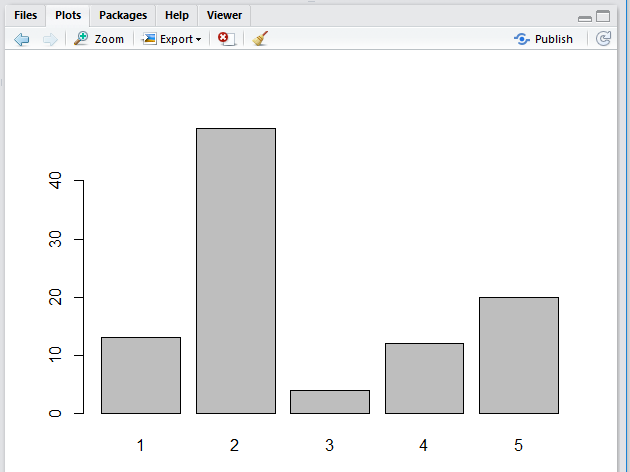
There is nothing wrong with the image shown in Figure 20.
In fact, it shows exactly what we
want to see, the distribution of values in Table 1.
It might be nice to make the image a bit more pretty.
Here are some steps that we might take to do that.
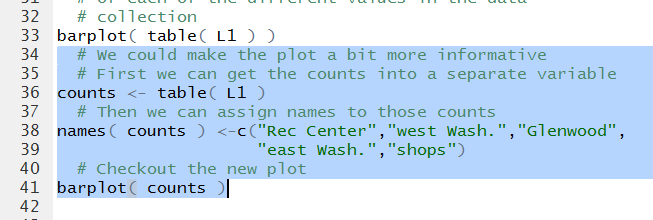
We start by just saving the results of the table(L1)
command in a new variable, counts.
Once that variable has been completed we can give
text names to each of the values in counts.
Then we can generate a new bar plot. The commands to do this are
shown in Figure 21.
Figure 21
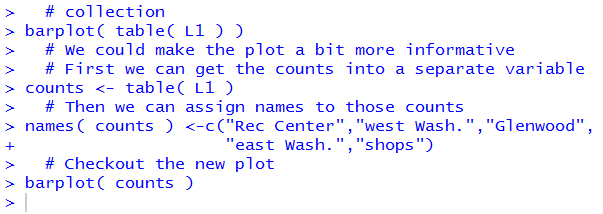
As we have seen before, the Console record just
notes that the commands have been
given and no error has been detected.
Figure 22
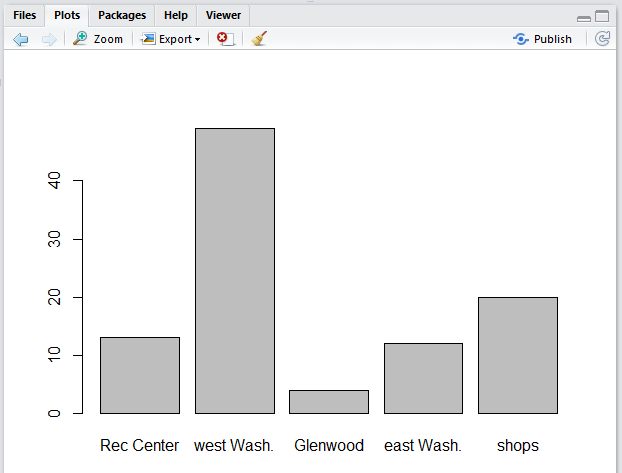
The new plot, ahown in Figure 23, now has
labels for the bars that make much more sense than did
1, 2, 3, 4, and 5.
Figure 23
There are more commands to pretty-up the plot.
A new version of the commands appears in
Figure 24.
Figure 24
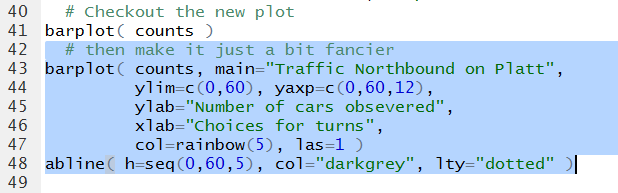
Running those commands produces the plot seen in
Figure 25.
Figure 25
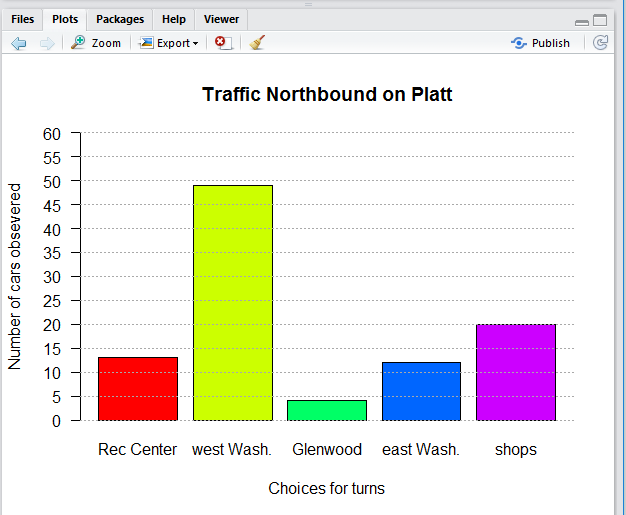
That is really more than we had to do, but it looks nice.
All that we have to do now is to wrap up our session.
In the Editor pane we click on the tab
for our command file, descriptivep2.R
Then we want to click on the  icon
to save the file, and turn the name back to a black font.
icon
to save the file, and turn the name back to a black font.
Figure 26
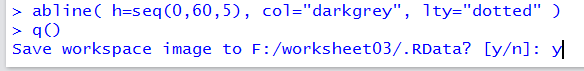
Then we use the q() function and we respond
to the propt with y
to close our session.
Figure 27
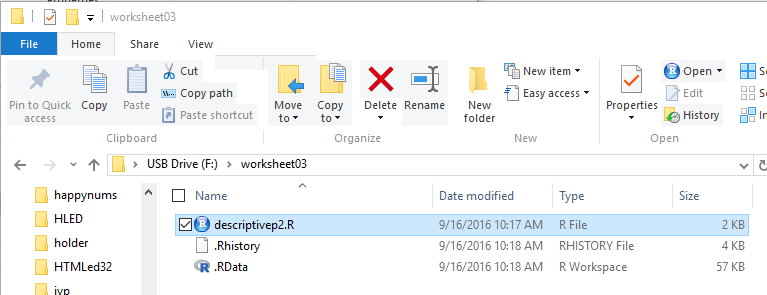
That should leave us still looking at the folder we have been using.
there we should be able to see our updated files (unless this is being
done on a Mac which hides the .RData and
.Rhistory files).
Figure 28
Here is a listing of the complete contents of the descriptivep2.R
file:
   #This session will create a collection of data
   # and then find the appropriate descriptive
   # measures for that data. From the problem statement
   # and the given data we know that we are using
   # NOMINAL data.

   #first we will load the gnrnd4  function that we
   #   will need here.  More may follow later.
source("../gnrnd4.R")
   # Now we are ready to create the data collection
gnrnd4( key1=294169707, key2=321925)
   # Then we can look at the data that we generated
L1
   # Our first task is to find the mode of the data.
   # It sure looks like there are a lot of 2's, but we
   # will load and use the Mode function to get a good
   # count of this.
source("../mode.R")
Mode( L1 )
  # To get a more complete description of this data
  # we can use the make_freq_table function.  Of course,
  # we need to load it first
source("../make_freq_table.R")
ft <- make_freq_table( L1 )
ft
View( ft )
  # For a picture of the data we turn to a bar plot.
  # But remember that the bar plot will generate bars that
  # that have heights (lengths) corresponding to the
  # values that we give it.  Therefore, we just want the count
  # of each of the different values in the data
  # collection
barplot( table( L1 ) )
  # We could make the plot a bit more informative
  # First we can get the counts into a separate variable
counts <- table( L1 )
  # Then we can assign names to those counts
names( counts ) <-c("Rec Center","west Wash.","Glenwood",
                    "east Wash.","shops")
  # Checkout the new plot
barplot( counts )
  # then make it just a bit fancier
barplot( counts, main="Traffic Northbound on Platt",
         ylim=c(0,60), yaxp=c(0,60,12),
         ylab="Number of cars obsevered",
         xlab="Choices for turns",
         col=rainbow(5), las=1 )
abline( h=seq(0,60,5), col="darkgrey", lty="dotted" )
Return to Topics page
©Roger M. Palay
Saline, MI 48176 September, 2016