| Table 1 | ||||
| Section 01 | Section 02 | |||
| # of 1's | 0 | # of 1's | 5 | |
| # of 2's | 0 | # of 2's | 0 | |
| # of 3's | 0 | # of 3's | 0 | |
| # of 4's | 20 | # of 4's | 0 | |
| # of 5's | 10 | # of 5's | 25 | |
| Section mean | 4.3333 | Section mean | 4.3333 | |
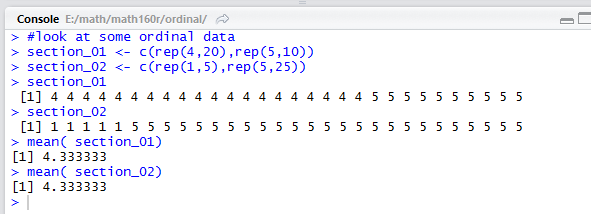
#look at some ordinal data
section_01 <- c(rep(4,20),rep(5,10))
section_02 <- c(rep(1,5),rep(5,25))
section_01
section_02
mean( section_01)
mean( section_02)
and the Console display from running those statements is shown in Figure 1.
However, the frequency distribution
for the two sections tells another story.
Whereas section 01 students view the instructor's
professionalism in a fairly unified way, the section 02
students fall into two very different groups.
One small group has the most negative view of the
instructor's professionalism while the other group
has the most positive view of the same thing.
As an evaluator I would be quite concerned about the situation in
section 02; it has a minority of students who are really upset.
The frequency distribution indicates that this section deserves a much closer examination!
For example, are there some students who have been insulted, demeaned,
embarrased, harassed, or slighted in
such a way as to create this gap?
An all too common instance of this kind of problem is where
a class that is "traditionally" taken by one gender
has an instructor who "plays" to that predominant
gender with sexist comments abut the minority gender.
Such problems may be completely hidden when we look at
mean values as an indicator of
disfunction.