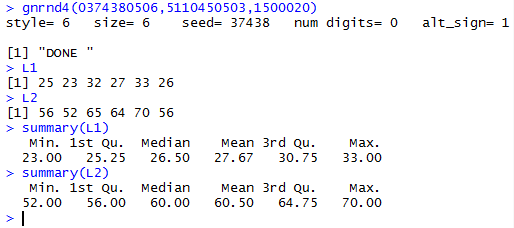
gnrnd4(0374380506,5110450503,1500020)
L1
L2
summary(L1)
summary(L2)
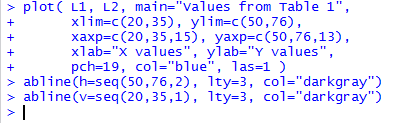
plot( L1, L2, main="Values from Table 1",
xlim=c(20,35), ylim=c(50,76),
xaxp=c(20,35,15), yaxp=c(50,76,13),
xlab="X values", ylab="Y values",
pch=19, col="blue", las=1 )
abline(h=seq(50,76,2), lty=3, col="darkgray")
abline(v=seq(20,35,1), lty=3, col="darkgray")
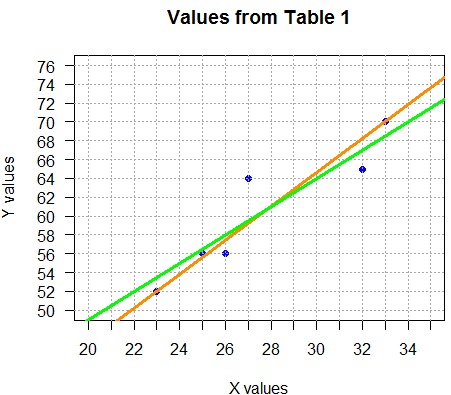
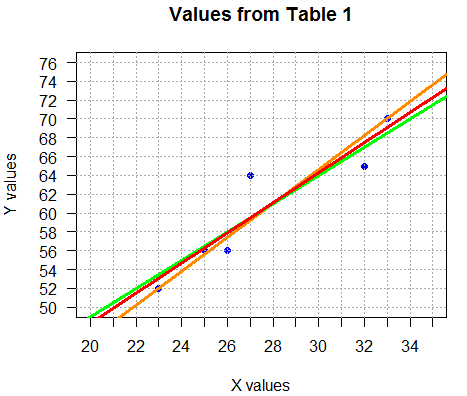
The resulting graph is shown in Figure 3.
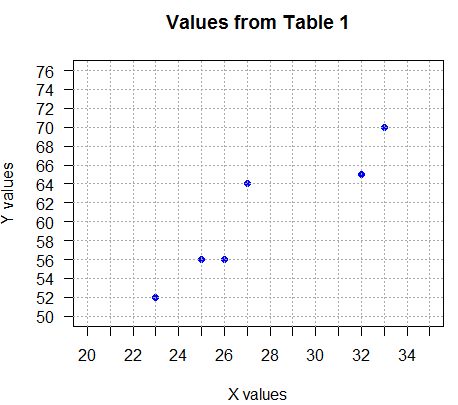
Just looking at Figure 3 one gets the impression that there
is a relationship between the x and y values.
The larger the x value, the larger, in general, is the
y value.
Clearly we cannot draw a single straight line that
hits all of the plotted points. However, we could
draw one that approximates the trend suggested by those points.
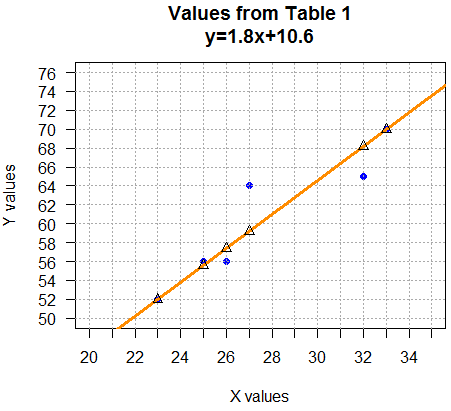
Consider the line shown in Figure 4.
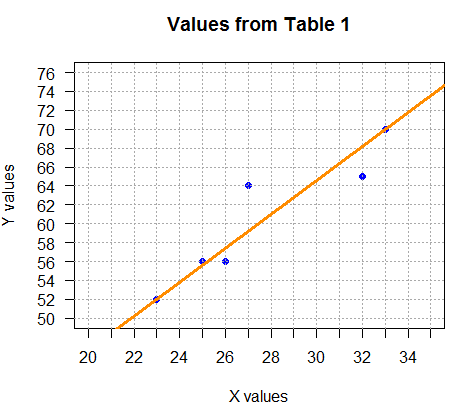
abline(a=10.6,b=1.8, col="darkorange", lwd=3).
Before we discuss the origin of that line, notice
how nicely the line "characterizes",
gives us a "feel" for, the relationship between x value
and y values. In this way, generating the line is almost
a new descriptive statistic.
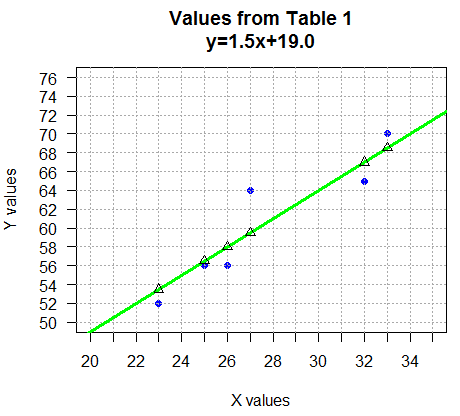
abline(a=19.0,b=1.5, col="green", lwd=3),
was defined by finding the equation of the line
through the points (22,52) and (34,70),
namely, y=1.5x+19.0.
lm(L2~L1) to call this function.
There are a few things to note here.
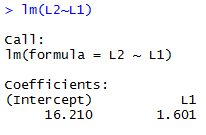
abline(a=16.210,b=1.601, col="red", lwd=3).
|
Before we go on, we should take a moment to talk about the
different ways to state, in general terms, the equation of a line.
In math classes, starting with pre-algebra and extending right through Calculus,
we consistently say that the "slope-intercept form"
of a straight line is given as y = mx + b,
where m is the slope of the line and b
is the y-coordinate of the y-intercept, meaning that the
line intersects the y-axis at the point (0,b).
Sometimes in statistics this same form is written as
y = ax + b, where a is the
slope and b is the y-coordinate of the y-intercept.
Other times in statistics, the slope-intercept form is written as y = a + bx, where a is the y-coordinate of the y-intercept and b is the slope. This particular convention is the one used by R, extensively. It is this convention that dictated our assignment of values in abline(a=10.6,b=1.8, col="darkorange", lwd=3)
so that a=10.6 makes the y-intercept be 10.6
and b=1.8 makes
the slope, that is the coefficient of x,
be 1.8, yielding the equation y=10.6+1.8x. Similarly, the
code abline(a=16.210,b=1.601, col="red", lwd=3)
yields y=16.21+1.601x.
This style continues to be evident in the arrangement of values shown back in Figure 8. The intercept value is given first, and then the command produces the coefficient of x value, i.e., the slope of the line. |
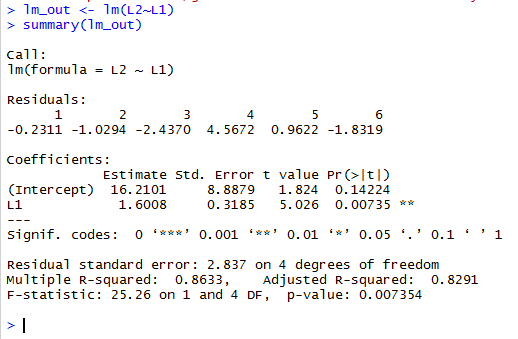
lm_out <- lm(L2~L1)
does not produce any output, but the following
summary(lm_out) generates many lines of information.
summary(lm_out) command where
we have more data points will have a different output for this residuals
section.
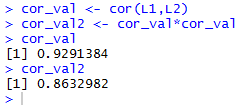
cor_val2<-cor_val*cor_val,
the square of the correlation coefficient.
This is shown in Figure 11, along with a display of the values
stored in the two variables.
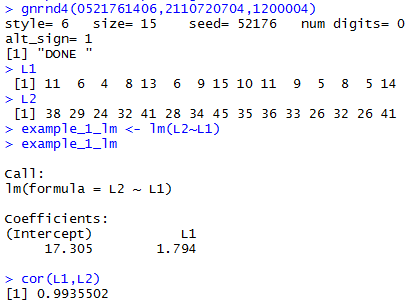

## positive slope, tight
gnrnd4(0521761406,2110720704,1200004)
L1
L2
example_1_lm <- lm(L2~L1)
example_1_lm
cor(L1,L2)
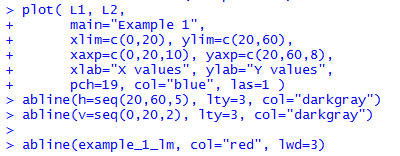
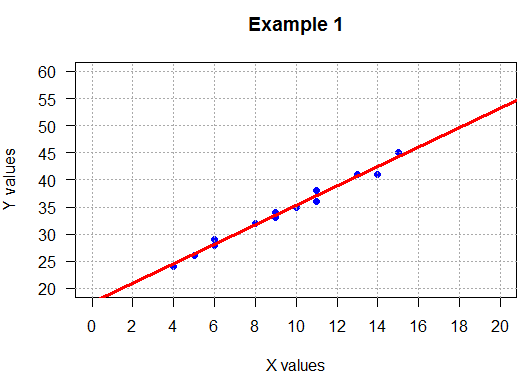
plot( L1, L2,
main="Example 1",
xlim=c(0,20), ylim=c(20,60),
xaxp=c(0,20,10), yaxp=c(20,60,8),
xlab="X values", ylab="Y values",
pch=19, col="blue", las=1 )
abline(h=seq(20,60,5), lty=3, col="darkgray")
abline(v=seq(0,20,2), lty=3, col="darkgray")
abline(example_1_lm, col="red", lwd=3)
##############
## positive slope, loose
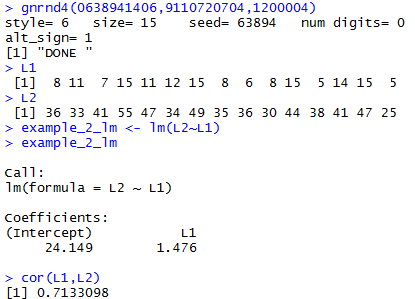
gnrnd4(0638941406,9110720704,1200004)
L1
L2
example_2_lm <- lm(L2~L1)
example_2_lm
cor(L1,L2)
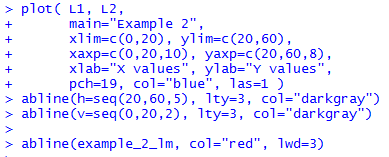
plot( L1, L2,
main="Example 2",
xlim=c(0,20), ylim=c(20,60),
xaxp=c(0,20,10), yaxp=c(20,60,8),
xlab="X values", ylab="Y values",
pch=19, col="blue", las=1 )
abline(h=seq(20,60,5), lty=3, col="darkgray")
abline(v=seq(0,20,2), lty=3, col="darkgray")
abline(example_2_lm, col="red", lwd=3)
##############
## negative slope, tight
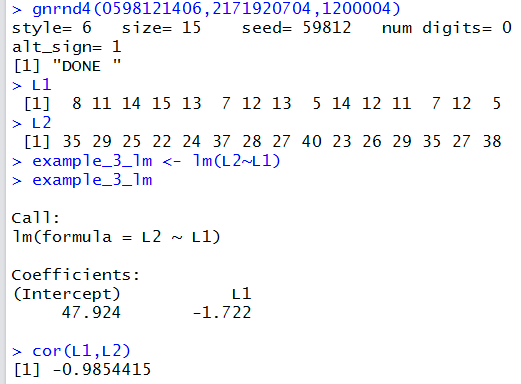
gnrnd4(0598121406,2171920704,1200004)
L1
L2
example_3_lm <- lm(L2~L1)
example_3_lm
cor(L1,L2)
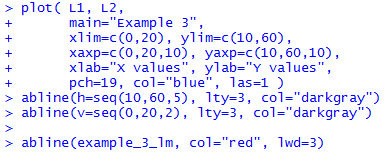
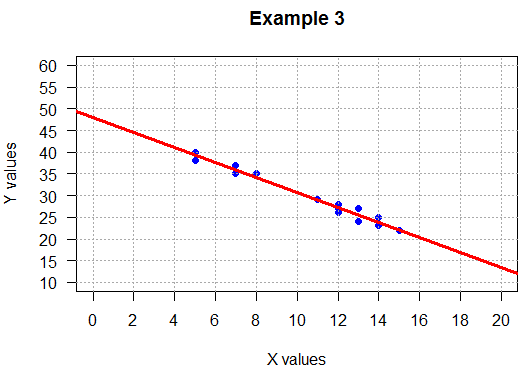
plot( L1, L2,
main="Example 3",
xlim=c(0,20), ylim=c(10,60),
xaxp=c(0,20,10), yaxp=c(10,60,10),
xlab="X values", ylab="Y values",
pch=19, col="blue", las=1 )
abline(h=seq(10,60,5), lty=3, col="darkgray")
abline(v=seq(0,20,2), lty=3, col="darkgray")
abline(example_3_lm, col="red", lwd=3)
##############
## negative slope, loose
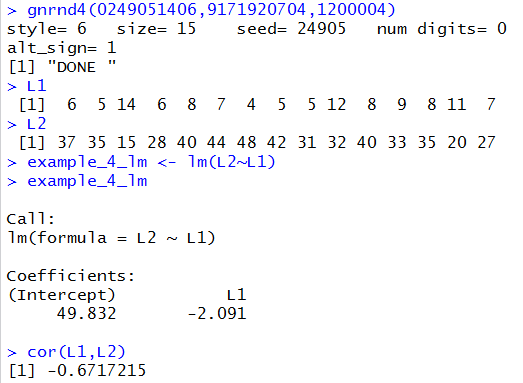
gnrnd4(0249051406,9171920704,1200004)
L1
L2
example_4_lm <- lm(L2~L1)
example_4_lm
cor(L1,L2)
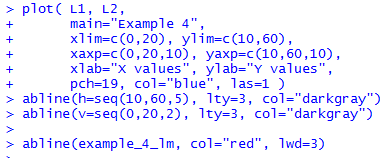
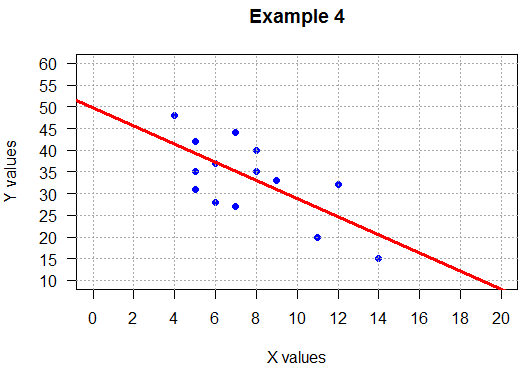
plot( L1, L2,
main="Example 4",
xlim=c(0,20), ylim=c(10,60),
xaxp=c(0,20,10), yaxp=c(10,60,10),
xlab="X values", ylab="Y values",
pch=19, col="blue", las=1 )
abline(h=seq(10,60,5), lty=3, col="darkgray")
abline(v=seq(0,20,2), lty=3, col="darkgray")
abline(example_4_lm, col="red", lwd=3)
##############
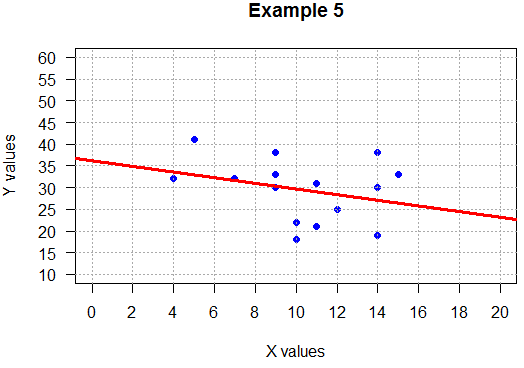
## no relation
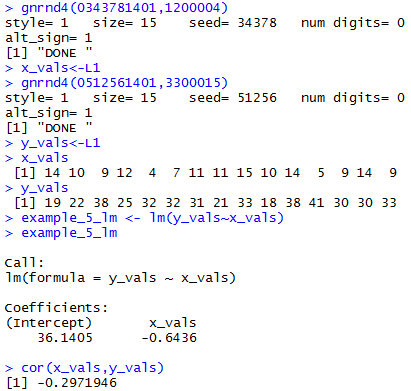
gnrnd4(0343781401,1200004)
x_vals<-L1
gnrnd4(0512561401,3300015)
y_vals<-L1
x_vals
y_vals
example_5_lm <- lm(y_vals~x_vals)
example_5_lm
cor(x_vals,y_vals)
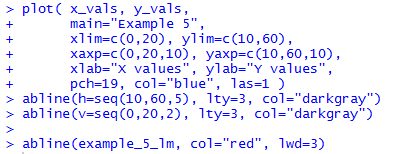
plot( x_vals, y_vals,
main="Example 5",
xlim=c(0,20), ylim=c(10,60),
xaxp=c(0,20,10), yaxp=c(10,60,10),
xlab="X values", ylab="Y values",
pch=19, col="blue", las=1 )
abline(h=seq(10,60,5), lty=3, col="darkgray")
abline(v=seq(0,20,2), lty=3, col="darkgray")
abline(example_5_lm, col="red", lwd=3)