Goodness of Fit: the χ² test
Return to Topics page
First a quick review of an earlier topic,
testing the hypothesis that the proportion of items in a population
is equal to some value against an alternative hypothesis. (This was done in
Topic 17.)
Let us say that we have a die
which we suspect has been weighted so that the "4" comes up more often than
it should. We know that in a fair die the probability of
getting a "4" should be ⅙ , that is, in a huge population of rolls of that die
the proportion of times that a "4" shows up should be really close to ⅙ .
If we want to run a test of the null hypothesis
H0: p4=⅙
against the alternative
H1: p4>⅙
and we wanted to run that test with a 0.025 level of significance, then we could
take a sample of rolls of the die, count the number of times we get a "4" and then
run the hypoth_test_prop() function.
Let us do that. We will roll the die 96 times.
Now we need to find the number of 4's in the table.
We can generate and verify the table in R and then count the
number of 4's in R using
source("../gnrnd4.R")
gnrnd4( key1=347129507, key2=6585376 )
L1
#  now find the number of "4"s
hold_table <- table( L1 )
hold_table
#  we are just interested in the number of 4's
num_4s <- as.integer( hold_table[4] )
num_4s
This will produce the console output shown in Figure 1.
Figure 1
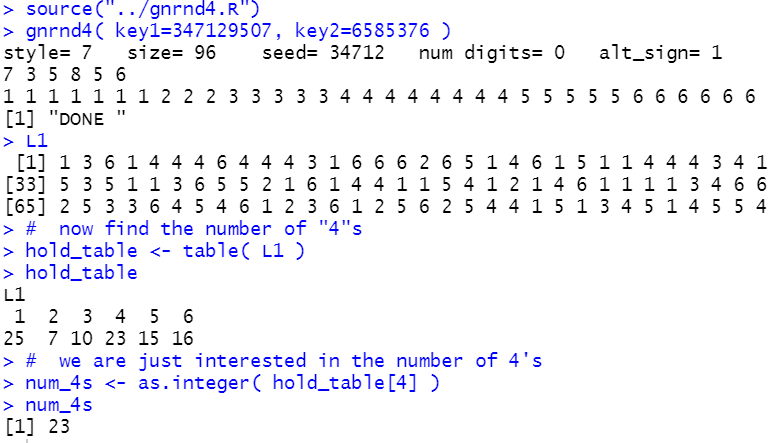
Knowing that "4" appears 23 times in our sample of 96 tosses means that we can
test, at the 0.025 level of significance,
the null hypothesis that the proportion of 4's is ⅙,
H0: p4=1/6,
against the alternative hypothesis that the proportion of 4's is greater than ⅙,
H1: p4>1/6,
by loading and running the hypoth_test_prop function,
source("../hypo_prop.R")
hypoth_test_prop( 1/6, num_4s, 96, 7, 0.025)
to produce
Figure 2
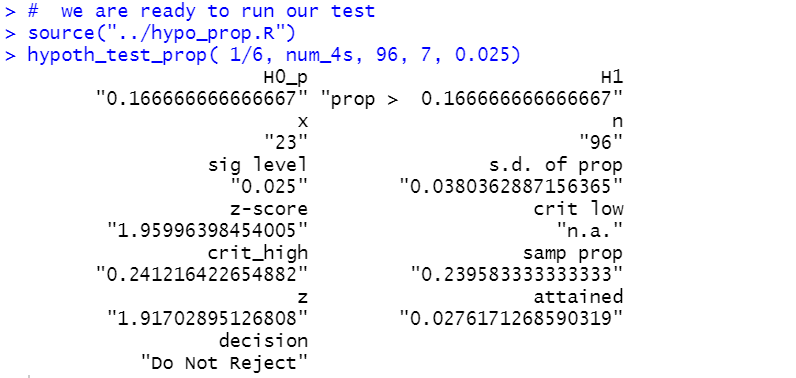
The result is that the attained significance is 0.0276 which is not
less than our level of significance, 0.025. Therefore, we do not have sufficient evidence
to reject H0. That is, based on our statistical test,
using our randomly generated sample, we cannot say that we have evidence to say that the
die is weighted in favor of "4".
But, what about the other possible values, the "1", "2", "3", "5", and "6"?
Should we run the same test, possibly changing "weighted in favor of" to "weighted against",
for each of these values?
We certainly have the ability to do this. It would just be running the
hypoth_test_prop() function with the appropriate values for each alternative.
However, we should not do this! Such running of multiple tests, looking for
some case where we get a significant result, merely "tempts fate" in the same way,
as we have seen in class demonstrations, that running sample after sample using
a single test at the 0.025 level of significane will result in making a
Type I error about 2.5% of the time.
This leaves us with the following question: How should we test
to see if this die is "fair", i.e., that the proportion of of times that each
face shows up is about ⅙? The answer to that is the goodness of fit
test.
Our null hypothesis is that all of the possible die faces have an equal chance of showing up.
That is, the proportion of each outcome should be ⅙. We could write this as
H0: p1=⅙,
p2=⅙,
p3=⅙,
p4=⅙,
p5=⅙, and
p6=⅙.
If H0 is true then with
a sample of 96 tosses we would expect to get 16 of each
of the possible outcomes.
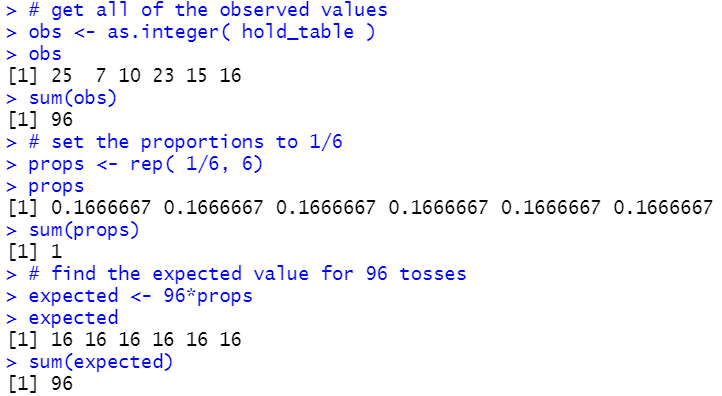
First calculate all of this in R.
 # get all of the observed values
obs <- as.integer( hold_table )
obs
sum(obs)
# set the proportions to 1/6
props <- rep( 1/6, 6)
props
sum(props)
# find the expected value for 96 tosses
expected <- 96*props
expected
sum(expected)
The console output for these is shown in Figure 3.
Figure 3
 We can make a table to show these values.
| Table 1 |
| item | 1 | 2 | 3 | 4 | 5 | 6 | total |
| observed count | 25 | 7 | 10 | 23 | 15 | 16 | 96 |
| H0 proportion | 1/6 | 1/6 | 1/6 | 1/6 | 1/6 | 1/6 | 1 |
| expected | 16 | 16 | 16 | 16 | 16 | 16 | 96 |
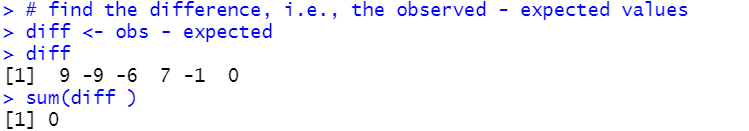
We are interested in the difference between the observed and the expected values.
Let us compute and display those differences and then add a row to show them.
 # find the difference, i.e., the observed - expected values
diff <- obs - expected
diff
sum( diff  )
Figure 4
| Table 2 |
| item | 1 | 2 | 3 | 4 | 5 | 6 | total |
| observed count | 25 | 7 | 10 | 23 | 15 | 16 | 96 |
| H0 proportion | 1/6 | 1/6 | 1/6 | 1/6 | 1/6 | 1/6 | 1 |
| expected | 16 | 16 | 16 | 16 | 16 | 16 | 96 |
| observed – expected | 9 | -9 | -6 | 7 | -1 | 0 | 0 |
It is pretty clear that although the observed - expected is interesting, it does not
tell us much, or at least, the sum of those values does not tell us much since it is always
going to be 0. Way back when we were learning about linear regression
we saw that taking the
square of the differences, that is (observed -expected)², had the effects of
getting rid of the negative values and of emphasizing the larger deviations. Let us add a
row for such values.
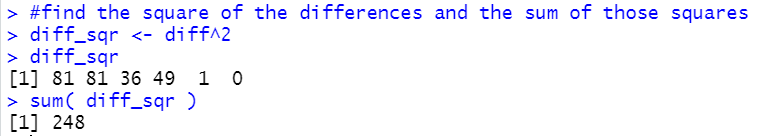
We will compute and display and add a row showing those values.
#find the square of the differences and the sum of those squares
diff_sqr <- diff^2
diff_sqr
sum( diff_sqr )
Figure 5
| Table 3 |
| item | 1 | 2 | 3 | 4 | 5 | 6 | total |
| observed count | 25 | 7 | 10 | 23 | 15 | 16 | 96 |
| H0 proportion | 1/6 | 1/6 | 1/6 | 1/6 | 1/6 | 1/6 | 1 |
| expected | 16 | 16 | 16 | 16 | 16 | 16 | 96 |
| observed – expected | 9 | -9 | -6 | 7 | -1 | 0 | 0 |
| (observed – expected)² | 81 | 81 | 36 | 49 | 1 | 0 | 248 |
In this particular case, where all of the expected values are the same,
it is hard to see the justification for our next step. But if our expected
values were not the same then being off by 2 from a high expected value would
put just as much into this row as would being off 2 from a low expected value.
However, this does not seem right. After all, if the expected value is 38 and we get a 40
we might feel that we are not that far off. But if the expected value is a 12 and we get 14
then that may strike us as a significant difference.
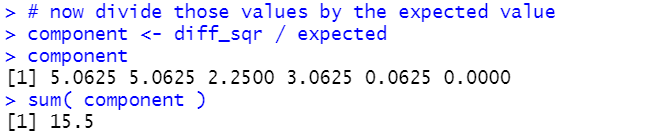
Therefore, our next step is to balance this out by dividing that last row
by the expected values to get (observed – expected)²/expected.
# now divide those values by the expected value
component <- diff_sqr / expected
component
sum( component )
Figure 6
| Table 4 |
| item | 1 | 2 | 3 | 4 | 5 | 6 | total |
| observed count | 25 | 7 | 10 | 23 | 15 | 16 | 96 |
| H0 proportion | 1/6 | 1/6 | 1/6 | 1/6 | 1/6 | 1/6 | 1 |
| expected | 16 | 16 | 16 | 16 | 16 | 16 | 96 |
| observed – expected | 9 | -9 | -6 | 7 | -1 | 0 | 0 |
| (observed – expected)² | 81 | 81 | 36 | 49 | 1 | 0 | 248 |
(observed – expected)²
expected | 5.0625 | 5.0625 | 2.25 | 3.0625 | 0.0625 | 0 | 15.5 |
That last computed value, the 15.5, is really important. It turns out that if the
null hypothesis were true and if we did repeated random samples of sufficient size then,
of course, we would not expect the observed values in each sample to be exactly
the same as the expected values. In fact, we could compute that final value for each
of those random samples. with 6 categories, as we have here, the distribution of that final value,
the sum of the values (observed – expected)²/expected,
would have a χ² distribution with 5 degrees of freedom (1 less than the
number of categories). Therefore, using our critical value approach, we
could find the χ² value that has 0.025 as the area to its right.
This will be our critical high value. If the
sum of the values (observed – expected)²/expected
is greater than that critical value then we can reject the null hypothesis at the 0.025 level
of significance. Let us find that χ² value:
# find the critical high value
qchisq( 0.025, 5, lower.tail = FALSE)
Figure 7

Using the critical value approach, 15.5 is larger than 12.8325 so we would reject
H0 and say that we have sufficient statistical evidence to say that the die is not fair,
that there is not an equal proportion of the times that the sides show up on tosses.
We have also used the attained significance approach to hypothesis testing problems.
Here we got our
sum of the values (observed – expected)²/expected
and found that to be 15.5. Therefore, we need to find out how strange would it be, if the
null hypothesis were true, to get a sum of 15.5 or higher.
Because this is a χ² distribution we find that using pchisq().
# use the attained significance approach
pchisq( 15.5, 5, lower.tail=FALSE)
Figure 8
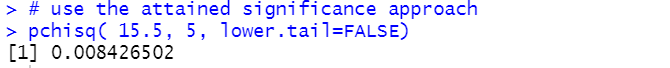
As always, if our attained significance level is smaller than our stated level of
significance then we reject the null hypothesis. Indeed, 0.0084 is less than 0.025
so we would reject H0 at the 0.025 level of significance.
Before we move on, we need to re-examine Table 4. That table is organized as rows
where we have columns for each of the observed items, plus a column for the totals.
We will transpose that table, giving exactly the same values, but organizing it
to have rows for each of the observed items.
| Table 4 (transposed) |
| item | obs
count |
H0 proportion |
expected |
obs-expected |
(obs-expected)² |
(obs-expected)²
expected |
| 1 | 25 | 1/6 | 16 | 9 | 81 | 5.0625 |
| 2 | 7 | 1/6 | 16 | -9 | 81 | 5.0625 |
| 3 | 10 | 1/6 | 16 | -6 | 36 | 2.2500 |
| 4 | 23 | 1/6 | 16 | 7 | 49 | 3.0625 |
| 5 | 15 | 1/6 | 16 | -1 | 1 | 0.0625 |
| 6 | 16 | 1/6 | 16 | 0 | 0 | 0.0000 |
| TOTAL | 96 | 1 | 96 | 0 | 248 | 15.5000 |
That transposed table looks just as good and it has the small benefit that even for a problem
with many more categories, this form of the table, which fits nicely on a printed page,
will get longer but not wider.
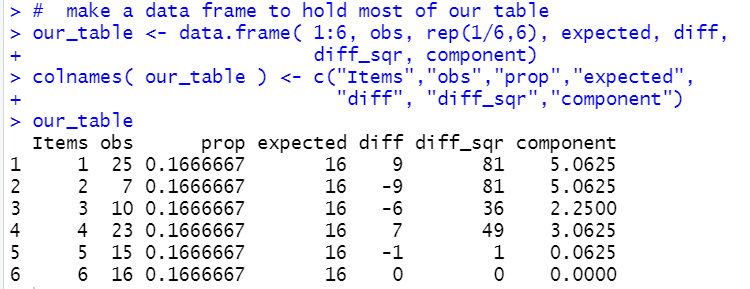
We can create a similar table in R via the following commands:
#  make a data frame to hold most of our table
our_table <- data.frame( 1:6, obs, rep(1/6,6), expected, diff,
                         diff_sqr, component)
colnames( our_table ) <- c("Items","obs","prop","expected",
                           "diff", "diff_sqr","component")
our_table
Figure 9
Before we talk about restrictions to this methodology and before we try to automate
this process, let us look at a new problem.
Here is a new problem: We have a funny shaped
solid that has 9 flat sides. The sides are numbered
from 1 to 9. We have a hypothesis that probability
that the solid, when "tossed", shows a particular number is
given by P(X=1)=5/53, P(X=2)=7/53, P(X=3)=3/53, P(X=4)=8/53,
P(X=5)=4/53, P(X=6)=6/53, P(X=7)=9/53, P(X=8)=3/53, and
P(X=9)=8/53. We would run this test, say at the 0.05 level,
the same way that we ran the test above. First, set up the
probabilities.
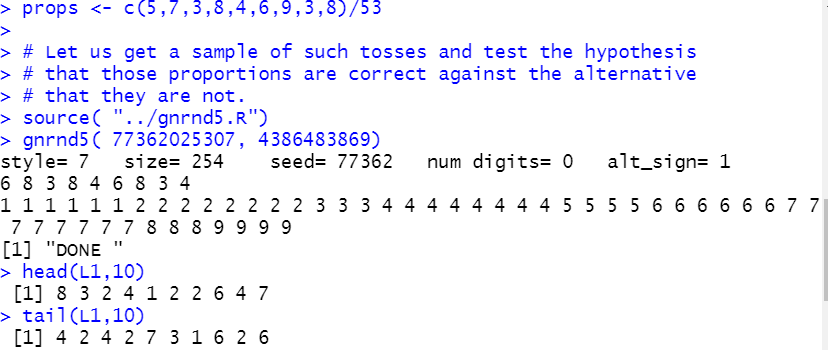
props <- c(5,7,3,8,4,6,9,3,8)/53
Then get our sample.
source( "../gnrnd5.R")
gnrnd5( 77362025307, 4386483869)
head(L1,10)
tail(L1,10)
Figure 10
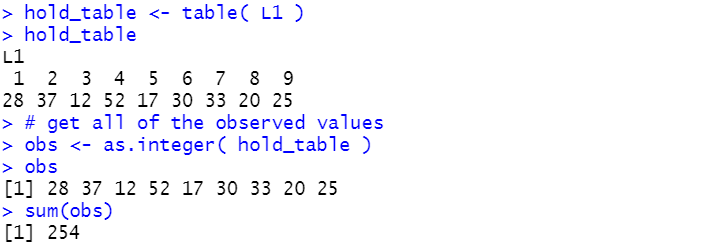
Then find out how many times we observe each of the nine faces.
hold_table <- table( L1 )
hold_table
# get all of the observed values
obs <- as.integer( hold_table )
obs
sum(obs)
Figure 11
Then find the expected values along with the differences,
observed - expected.
# find the expected value for 254 tosses
expected <- 254*props
expected
sum(expected)
# find the difference, i.e., the observed - expected values
diff <- obs - expected
diff
sum(diff )
Figure 12
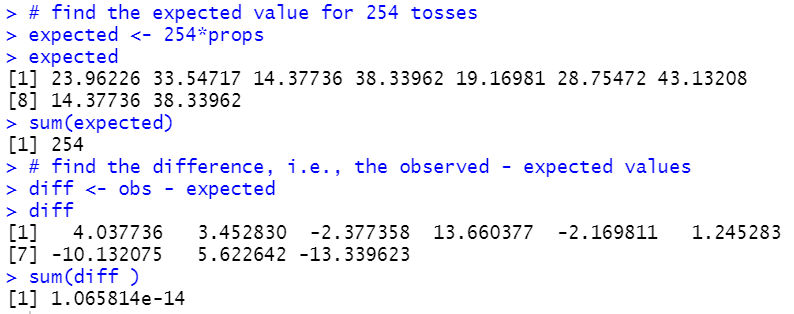
Again, when we add up the differences, we get 0, or really close to it
given the rounding errors in the computer.
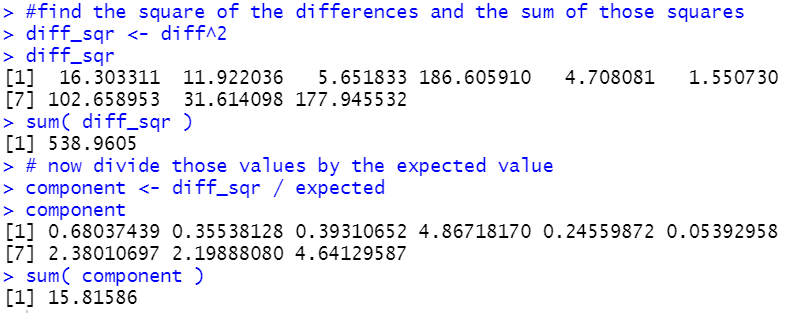
Moving forward we find the
squares of the differences and then we find the
quotient of those squared values and the expected values, along with
finding the sum of those quotients.
 #find the square of the differences and the sum of those squares
diff_sqr <- diff^2
diff_sqr
sum( diff_sqr )
# now divide those values by the expected value
component <- diff_sqr / expected
component
sum( component )
Figure 13
Noting that we have 9 different categories, we know that we will have
8 degrees of freedom. We can find our critical value for our
0.05 level of significance test via
# find the critical high value
qchisq( 0.05, 8, lower.tail = FALSE)
Figure 14

Thus, our test statistic, 15.81586 is greater than our critical high value
15.50731 so we reject the null hypothesis at the 0.05 level
of significance. Alternatively, we could have used the attained significance
approach and found out how strange it would be, if the null hypothesis were true, to
get a sample with results showing that sum of 15.81586?
# use the attained significance approach
pchisq( 15.81586, 8, lower.tail=FALSE)
Figure 15

The attained significance is 0.045 which is less than our stated level of 0.05 so we would
reject the null hypothesis and say that we have statistical evidence that the
funny solid shape does not have the proportion of faces on tosses as that was given in the
problem statement.
Restrictions
First of all, it is important to note that the probabilities for
the different categories added to 1. That was because we were looking at all of the
possible outcomes. We need not have done that.
We could have just tested to see if some set of
the possible outcomes had particular proportions.
Second, of course, those all have to be
positive values. Third, the expected values must add to the same size as we
had in the observed values. And fourth, all of the expected values must be 5 or larger.
This last restriction is needed because in our calculations, if the denominator in the expression
(observed – expected)²/expected is small then that term has
an overpowering effect on the total.
Automating the proceess
As we have seen, the steps to solve the problem do not change.
We need to have the null hypothesis proportions (probabilities), the
observed counts, and the specified significance level for the test.
Everything else is computed in the process. It might be nice to add the names of
the different categories. the function goodfit() does this.
# Roger Palay copyright 2021-04-12
# Saline, MI 48176
#
# in the goodfit function:
#    items   is a list of the item values (i.e., labels)
#    H_null  is a list of the hypothesized proportions
#    observed is a list of the observed counts of items
#    sig_level is the level at which the test is to be run
#    show_table if TRUE will cause the function to use
#               View to display a nice table of values
goodfit <- function( items, H_null, observed,
                     sig_level,show_table=FALSE )
{
  #  there are a few  checks that we should make

  #  first, is the sum of the H_null proportions == 1
  sum_H0 <- sum( H_null )
  if( abs( sum_H0 - 1) > 0.00000001)
  { return("H_null proportions must add to 1")}

  #  second, all of the H_null values must be non-negative
  find_negs <- which( H_null < 0 )
  if( length( find_negs ) > 0 )
  {return( "cannot have negative proportions")}

  #  Third, we need the same number of items,
  #       H_null proportions, and observed frequencies
  items_length <- length( items )
  H0_length <- length( H_null )
  obs_length <- length( observed )
  if( items_length != H0_length |
      items_length != obs_length)
  { return("Need same number of items, proportions, and observed frequencies")}

  obs_total <- sum(observed)
  expected <- H_null*obs_total
  #   Fourth, we need enough expected values
  num_too_small <- length( which( expected < 5))

  if( num_too_small > 0 )
  { cat( "expected values, some too small","\n")
    cat(expected,"\n")
    return("use larger sample")}
  diff <- observed - expected
  diff2 <- diff^2
  chi_component <- diff2/expected
  total = sum( chi_component )
  goff_table <<- data.frame( items, H_null, observed, expected,
                             diff, diff2, chi_component)
  colnames( goff_table ) <- c( "Items","H_null", "observed", "expected",
                               "diff", "diff^2", "chi component")
  print( goff_table)
  if( show_table ) {View( goff_table )}
  cat( "-----------------------------------\n")
  cat("total observations = ",obs_total,"\n")
  cat("Number of categoies = ", obs_length,"\n")
  cat("Number of degrees of freedom = ", (obs_length-1),"\n")
  cat("Total of chi component =", total,"\n")
  cat("P(total >= ",total,") = ",
      pchisq(total, obs_length-1,lower.tail=FALSE), "\n")
  crit_value <- qchisq( sig_level, obs_length-1, lower.tail=FALSE)
  cat("For ",(sig_level*100),"% to the right, the ","\n")
  cat("    critical value  is ", crit_value, "\n")
  if( total > crit_value )
  { "reject H0"}
  else
  {" not enough evidence to reject H0"}
}
You might notice that the first parameter that you need to give the
function is a list of the names of the categories. For the numbers 1 to 9 this is as easy
as using 1:9. However, you might have a case where the
names of the categories are colors. For that you could create a
variable to hold the names of the colors, such as
hold_colors <- c("blue","red","green","orange","purple")
and then use that variable as the first parameter of the function call.
The second parameter gives the proportions (probabilities) for the null hypothesis.
In the previous problem we put those into a variable
called props
via
props <- c(5,7,3,8,4,6,9,3,8)/53
Therefore, we could use props as the second parameter.
The third parameter is our list of the number of times each of the categories is observed in
the sample. Above we had taken a few steps to make list:
hold_table <- table( L1 )
hold_table
# get all of the observed values
obs <- as.integer( hold_table )
obs
If we have done that then we could use obs as the third parameter.
However, if you were looking for a shorcut, you could just use as.integer(table(L1))
in that place.
The fourth parameter is just the level of significance for our test. And the fifth parameter, which
is optional, specifies if you want the function to automatically force a View
of the data frame that the function creates. What may not be obvious is that the
function creates that data frame, called goff_table, in the environment.
Even if you do not ask the function to show the data frame it is still there for you.
So, assuming that you have generated the sample in L1, then you could perform our last test
via
source("../goodfit.r")
props <- c(5,7,3,8,4,6,9,3,8)/53
goodfit(1:9, props, as.integer(table(L1)), 0.05,FALSE)
And this produces the output shown in Figure 16.
Figure 16
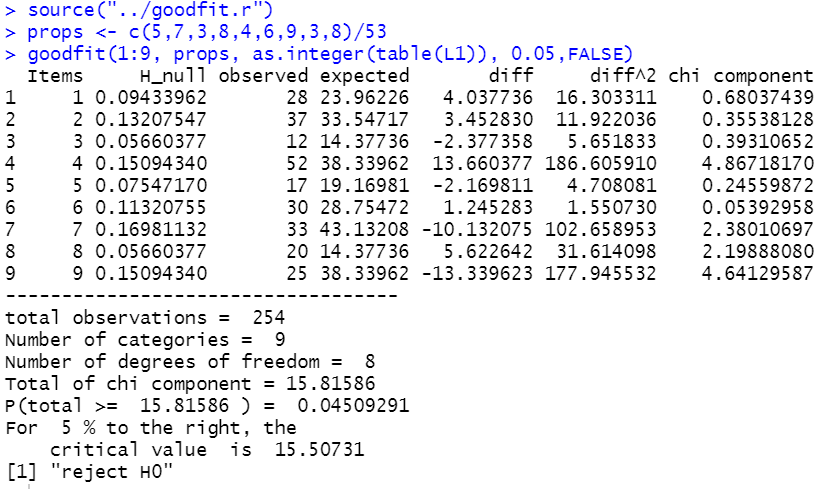
Below are the R lines of script that were used to generate this page:
# statements used in the production of
# the goodnessoffit.htm web page
#

# generate the data for Table 1
source("../gnrnd4.R")

gnrnd4( key1=347129507, key2=6585376 )
L1
#  now find the number of "4"s
hold_table <- table( L1 )
hold_table
#  we are just interested in the number of 4's
num_4s <- as.integer( hold_table[4] )
num_4s
#  we are ready to run our test
source("../hypo_prop.R")
hypoth_test_prop( 1/6, num_4s, 96, 7, 0.025)

# get all of the observed values
obs <- as.integer( hold_table )
obs
sum(obs)
# set the proportions to 1/6
props <- rep( 1/6, 6)
props
sum(props)
# find the expected value for 96 tosses
expected <- 96*props
expected
sum(expected)
# find the difference, i.e., the observed - expected values
diff <- obs - expected
diff
sum(diff )
#find the square of the differences and the sum of those squares
diff_sqr <- diff^2
diff_sqr
sum( diff_sqr )
# now divide those values by the expected value
component <- diff_sqr / expected
component
sum( component )
# find the critical high value
qchisq( 0.025, 5, lower.tail = FALSE)
# use the attained significance approach
pchisq( 15.5, 5, lower.tail=FALSE)

#  make a data frame to hold most of our table
our_table <- data.frame( 1:6, obs, rep(1/6,6), expected, diff,
                         diff_sqr, component)
colnames( our_table ) <- c("Items","obs","prop","expected",
                           "diff", "diff_sqr","component")
our_table


#######################################
#  here is a new problem:  We have a funny shaped
#  solid that has 9 flat sides.  The sides are numbered
#  from 1 to 9.  We have a hypothesis that probability
#  that the solid, when "tossed", shows a particular number is
#  given by P(X=1)=5/53, P(X=2)=7/53, P(X=3)=3/53, P(X=4)=8/53,
#  P(X=5)=4/53, P(X=6)=6/53, P(X=7)=9/53, P(X=8)=3/53, and
#  P(X=9)=8/53.

props <- c(5,7,3,8,4,6,9,3,8)/53

# Let us get a sample of such tosses and test the hypothesis
# that those proportions are correct against the alternative
# that they are not.
source( "../gnrnd5.R")
gnrnd5( 77362025307, 4386483869)
head(L1,10)
tail(L1,10)
hold_table <- table( L1 )
hold_table
# get all of the observed values
obs <- as.integer( hold_table )
obs
sum(obs)
# find the expected value for 254 tosses
expected <- 254*props
expected
sum(expected)
# find the difference, i.e., the observed - expected values
diff <- obs - expected
diff
sum(diff )
#find the square of the differences and the sum of those squares
diff_sqr <- diff^2
diff_sqr
sum( diff_sqr )
# now divide those values by the expected value
component <- diff_sqr / expected
component
sum( component )
# find the critical high value
qchisq( 0.05, 8, lower.tail = FALSE)
# use the attained significance approach
pchisq( 15.81586, 8, lower.tail=FALSE)

#  now show off the function to do this
source("../goodfit.r")
props <- c(5,7,3,8,4,6,9,3,8)/53
goodfit(1:9, props, as.integer(table(L1)), 0.05,FALSE)
Return to Topics page
©Roger M. Palay
Saline, MI 48176 April, 2020