Stem-and-Leaf Diagram
This page is devoted to presenting, in a
step by step fashion, the keystrokes and the
screen images for doing a generating a
Stem-and-Leaf Diagram on a TI-83 (TI-83 Plus, or TI-84 Plus) calculator.
The step-by-step commitment is meant to apply to
the actions that we take beyond prior learning. In particular,
this page follows on the patterns and steps shown in
numerous earlier pages. If some of the "steps" presented here are "too big" then
the reader is refered to those
earlier pages.
After presenting the problem, we generate
the required data on the calculator.
Our first attempt will be to do the diagram based on the data as given.
Next we will sort the data, and redo the diagram.
Following that, we will run the COLLATE2 program
to obtain data from which we can directly build, without paging through the data,
the stem-and-leaf diagram.
After that, we will use the STEM10 program as a quick way to
generate the solution.
Finally, we will repeat the demonstration of the STEM10
for three more sets of data, looking at its limitations and
learning methods to overcome those limitations.
We need to start with some data.
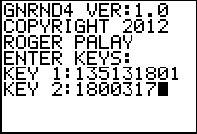
We will generate a list of data on the calculator using
GNRND4 with Key 1=135131801 and Key 2=1800317. That list
will be the same numbers that appear in the following table:
Thus, our problem will be to generate a stem and leaf diagram for the data in the
list above.
To demonstrate these steps we need to start with some data. We will use the
GNRND4 program on the calculator to generate this data.
Figure 1
|
Use GNRND4 to generate the data using the appropriate key values.
|
Figure 2
 |
The program ends and we have the data in L1.
We want to use the Stat Editor to look at the data.
|
Figure 3
 |
Use  to open the STAT menu.
Press to open the STAT menu.
Press  to open the editor. to open the editor.
|
Figure 4
 |
The editor is open, but the wrong lists are displayed.
We need to return to the STAT menu to find the SetUpEditor
command. Press to get back to that menu.
|
Figure 5
 |
Press  to paste the command
SetUpEditor onto the main screen. to paste the command
SetUpEditor onto the main screen.
|
Figure 6
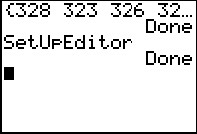 |
Once the command is pasted here press
to have the calculator perform the command. The
SetUpEditor command, when used alone, places the built-in lists,
L1, L2,
L3, L4
L5, and L6,
in the editor.
Then return to the STAT menu via
and move tot he editor via .
|
Figure 7
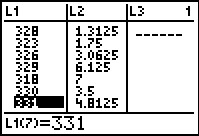 |
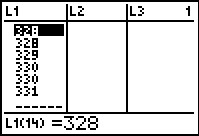
In Figure 7 we can see L1,
L2, and L3.
We are only intersted in the values in L1.
These were created by the run of GNRND4. It is from these numbers that we
will build the stem-and-leaf diagram.
Reading down the list
of values shown,
see that we will have stem values of 32, 31, and 33.
Thus, we start our diagram as
31:
32:
33:
Then, again reading down,
from 328 we will append 8 to the 32: row, to get 32:8
from 323 we will append 3 to the 32: row, to get 32:83
from 326 we will append 6 to the 32: row, to get 32:836
from 329 we will append 9 to the 32: row, to get 32:8369
from 318 we will append 8 to the 31: row, to get 31:8
from 330 we will append 0 to the 33: row, to get 33:0
from 331 we will append 1 to the 33: row, to get 33:01
|
Figure 8
 |
We use the  key to see the next 7 items in the list.
We process them as
from 324 we will append 4 to the 32: row, to get 32:83694 key to see the next 7 items in the list.
We process them as
from 324 we will append 4 to the 32: row, to get 32:83694
from 327 we will append 7 to the 32: row, to get 32:836947
from 321 we will append 1 to the 32: row, to get 32:8369471
from 328 we will append 8 to the 32: row, to get 32:83694718
from 330 we will append 0 to the 33: row, to get 33:010
from 319 we will append 9 to the 31: row, to get 31:89
from 319 we will append 9 to the 31: row, to get 31:899
|
Figure 9
 |
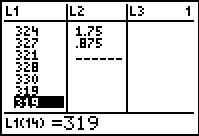
We use the key to see the last items in the list.
Note that the highlighted line is the 14th entry, one we have already used. Therefore, there are only 5
remaining values to address.
We process them as
from 321 we will append 1 to the 32: row, to get 32:836947181
from 322 we will append 2 to the 32: row, to get 32:8369471812
from 325 we will append 5 to the 32: row, to get 32:83694718125
from 318 we will append 8 to the 31: row, to get 31:8998
from 319 we will append 9 to the 31: row, to get 31:89989
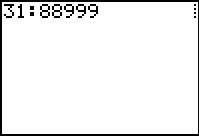
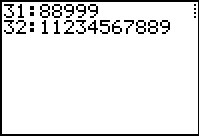
Once that is done, we look at each of the stem lines that we have produced and we sort the leaves in those lines.
Thus,
| 31:89989 | becomes | 31:88999
|
| 32:83694718125 | becomes | 32:11234567889
|
| 33:010 | becomes | 33:001 |
and we have our stem-and-leaf diagram.
|
So much for the painful approach to creating a stem-and-leaf diagram.
Much of our effort above was moving back and forth between stem
values as we process each of the 19 values in the list. We could make this much easier if
we just had the original list sorted. We will do the problem again to see the benefit.
Figure 10
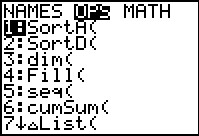 |
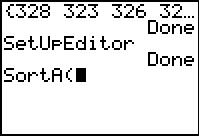
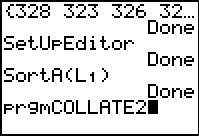
L1 is still there. We just need to sort it. Move to the
LIST menu via  .
Then move to the OPS sub-menu via .
Then move to the OPS sub-menu via  .
The option we want is the one that is
already highlighted, namely SortA(, so press
to select that option. .
The option we want is the one that is
already highlighted, namely SortA(, so press
to select that option.
|
Figure 11
 |
Having pasted the command to the screen, we complete it with

 as shown in Figure 12. as shown in Figure 12.
|
Figure 12
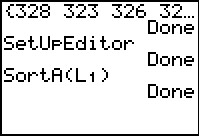 |
Once the command is formed, we press
to have the calculator execute the command. It responds with Done.
We then open the Editor
( ).
|
Figure 13
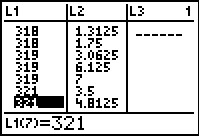 |
Unlike the display in Figure 7, we can now see the complete, and ordered,
stem and leaf for 31: in Figure 13. We can just read the values
and see that we will have 31:88999. In addition, we see the start of the
32 stem, and we could begin to construct it as 32:11. However, we will have to
move down the list to see more of it.
|
Figure 14
 |
Here we still see the 7th item along with the
next 6 items. We can continue forming the 32 stem with these values
to get 32:11234567.
|
Figure 15
 |
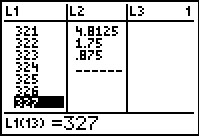
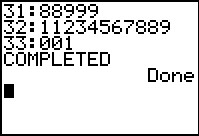
Moving down to see the rest of the items we complete the 32
stem as 32:11234567889 and we build the 33 stem as
33:001.
|
Processing the sorted list was much easier. We still had to read down the
list and keep track of which values we
had used.
However, we did not need to move back and forth between stems and we
constructed the diagram in order so we did not have to sort the items at the end.
Another approach to the problem is to use the COLLATE2 program.
We will do the problem again to see the benefit of that approach.
Figure 16
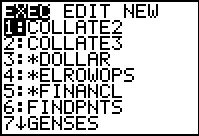 |
Open the list of programs on the calculator.
Select the COLLATE2 program.
|
Figure 17
 |
Have the calculator execute tht program.
|
Figure 18
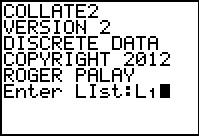 |
Give the program the location of the data to be used.
|
Figure 19
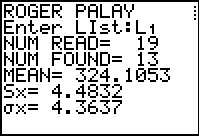 |
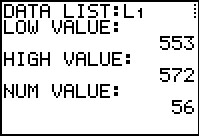
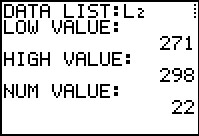
The display output of the program is interesting, but not really helpful,
except to tell us that there are 19 entries with 13 separate valeus.
|
Figure 20
 |
We let the program finish.
|
Figure 21
 |
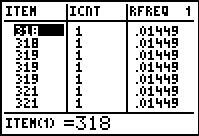
Remember that the COLLATE2 produces some lists and resets the Stat Editor
to display those lists. We open the Stat Editor and we pay attention to the
first two lists. These give the different ITEMS and the ITEM COUNT for each item.
Thus, we see that there were 2 318's and 3 319's. But that means that
we could construct the 31 stem as 31:88999. From the rest of the
values in this Figure, we could start the 32 stem as 32:112345.
However, we need to move down teh list to see more values.
|
Figure 22
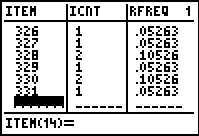 |
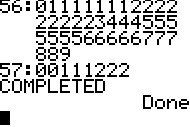
Figure 22 has the rest of the list. From this we finish the 32 stem
as 32:11234567889 and we get the 33 stem as
33:001.
|
Using the lists created by COLLATE2 is an alternative approach to
creating the stem-and-leaf diagram. Any of the three
methods presented so far will work, the latter two seeming to require less effort on our part.
However, all three methods demonstrate that building such a diagram is
a matter of following a specific set of steps, each of which involves making a
clear decision based on the information at hand.
Such a situation would seem perfect for a programmatic solution. The
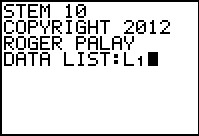
STEM10 program is such a solution. The actions within
STEM10 correspond to our second approach, namely, sort the values
and then look down the list building each stem in order.
Of course, we do not have to know this in order to use the
program.
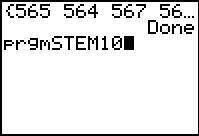
Figure 23
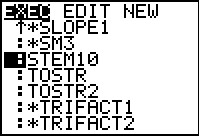 |
In Figure 23 we open the list of programs and highlight STEM10.
Then we press to paste the command onto the main screen.
|
Figure 24
 |
With the command pasted here, press
to run the program.
|
Figure 25
 |
We give the program the location of the data,
in this case L1.
|
Figure 26
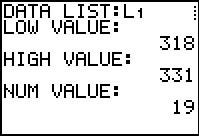 |
The program gives us some preliminary information
and waits until we hit to continue.
|
Figure 27
 |
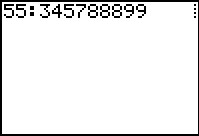
The program clears the screen, computes the first stem, and
displays it. We press to continue.
|
Figure 28
 |
The program computes the second stem and displays it.
We press to continue.
|
Figure 29
 |
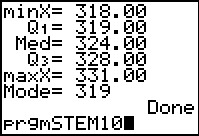
The program displays the third stem. We press
to continue. However there is no more so the program terminates.
We have our complete stem-and-leaf solution.
|
In the Figures above we have seen a number of ways of
constructing a stem-and-leaf diagram. The last approach
showed how the STEM10
program does this task for us. Let us look at a much larger data set
to see more of STEM10.
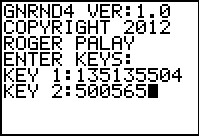
As usual, we will generate a list of data on the calculator, this time using
GNRND4 with Key 1=135135504 and Key 2=500565. That list
will be the same numbers that appear in the following table:
Thus, our problem will be to generate a stem-and-left diagram for the data in the
list above.
Figure 30
 |
Start GNRND4.
|
Figure 31
 |
Start STEM10
|
Figure 32
 |
Give STEM10 the location of our data.
|
Figure 33
 |
Get the initial information from the program
|
Figure 34
 |
Get the first stem.
|
Figure 35
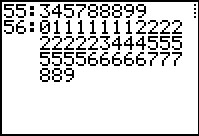 |
Get the second stem. Note that this set of leaf values is too long to fit on our screen.
Therefore, the program displays the leaves across multiple lines, indenting the second and subsequent lines.
We press to continue.
|
Figure 36
 |
Here is the final line and we completd the program.
|
We have just seen STEM10 work on a larger data set.
Now let us return to a smaller one, but one where the values in the data set
pose a different problem.
We will generate a list of data on the calculator, this time using
GNRND4 with Key 1=3041672104 and Key 2=7102864. That list
will be the same numbers that appear in the following table:
Thus, our problem will be to generate a stem-and-left diagram for the data in the
list above.
Figure 37
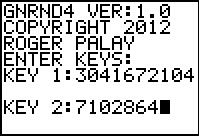 |
Run GNRND4.
|
Figure 38
 |
Start the STEM10 program.
|
Figure 39
 |
Give STEM10 the data source.
|
Figure 40
 |
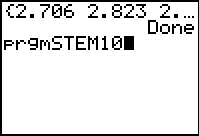
Get the initial output of the program.
Press to continue.
|
Figure 41
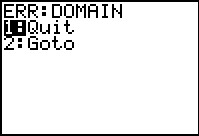 |
And we have run into an error! What happened?
|
Among other things, what happened was that we blindly ran the program.
We did not even consider what we want the program to do. If we go back to the data
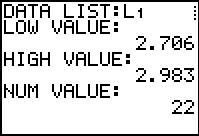
shown in the table above, or if we examine the initial output in Figure 40,
we see that our values are all between 2.706 and 2.983, inclusive.
This is quite different data than the values that we used in
the former examples. There we were getting the stem
value as the number, reading from the left, up to and including the 10's
digit. Thus, in our first data set we had stems of 31, 32, and 33
representing the 310 to 319 range, the 320 - 329 range, and
the 330-339 range, respectively. In the second data set we had stems
of 55, 56, and 57, representing the 550-559 range,
the 560 - 569 range, and the 570 -579 range, respectively.
Thus, in the previous cases, the cut-point is between the unit's and the ten's place.
that is where we make the break between the stem
and the leaf in each of our values. If we did that for the values in the
table we are using now then the stem value in each case would be 0, since there is no
value in the tens place, and the leaf for each value would be 2, since that
is the units digit in all our valeus. Our stem-and-leaf
diagram would be 0:2222222222222222222222, a useless diagram if ever there was one.
The STEM10 program was written to have the cut-point between the
ten's and the unit's place in the values, hence the name STEM10.
Furthermore, the STEM10 program expects to find positive integer values,
not decimal values. The program will not work with the data we have.
Looking at that data, it makes more sense to have the cut-point be
between the tenth's place and the hundredth's place. That is in the first three
values we want to look at 2.706 as having a stem of 2.7 and a
leaf of 1 (rounding the 06 to the 1),
2.823 as having a stem of 2.8 and a
leaf of 2 (rounding the 23 to the 2), and
2.893 as having a stem of 2.8 and a
leaf of 9 (rounding the 93 to the 9.
What do we do?
One choice would be to
copy the STEM10 to some other name and then modify it to
have the cut point where we want it. This is a complex and ugly solution because we
would have to have many copies of the program, one for each different cut point.
If we had a change to make in the program
then we would have to make changes in each version of the program.
An alternative would be to change the STEM10
program to ask the user for the cut-point. That would make the
program a little longer, and a little more complex,
but the result would be a much more useful program. Perhaps someone will
do that.
In fact, after this was first written, I went back and created just such a program
called STEMCD.
A different page will be created to describe the use of that program. But at the moment, we still want to
accomplish our task. What else can be done?
A completely different approach is to modify our data to fit the
requirements of the program.
If we were to take our 22 values and multiply each of them by 100, rounding
the results to whole numbers, then we would have a data that fits the
design of our current STEM10 program. Of course, we would have to re-interpret the
output to undo the change we made in the data, but that is not a hard task at all.
Figure 42
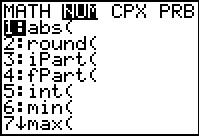 |
We will accomplish our change in the data by starting in the MATH
menu (use the  key), moving to the NUM
sub-menu, and then pressing to paste the round(
command onto the main screen. key), moving to the NUM
sub-menu, and then pressing to paste the round(
command onto the main screen.
|
Figure 43
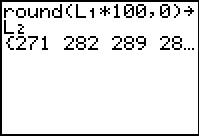 |
Continuing to build the command we type


 and follow that with
to have the calculator run the command.
In doing this the calculator then displays the result.
These look just like the valeus that we wanted. Now we can return
and run the STEM10 program on these values.
and follow that with
to have the calculator run the command.
In doing this the calculator then displays the result.
These look just like the valeus that we wanted. Now we can return
and run the STEM10 program on these values.
|
Figure 44
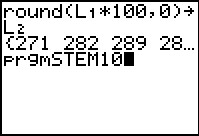 |
We get the command to run the program and then
press to start it.
|
Figure 45
 |
We give the program the location of the data that we want it to process;
this is now L2. Press
to go forward.
|
Figure 46
 |
This is the initial output of the program.
|
Figure 47
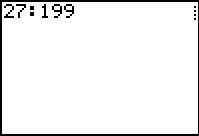 |
Here is the first stem output. However, if we were to report this anywhere
we would re-write it as 2.7:199 to account for the change we made.
|
Figure 48
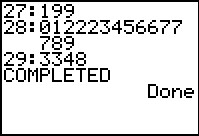 |
We get the rest of the output from the program.
Our final, reportable, version of the diagram would be:
2.7:199
2.8:012223456677789
2.9:3348
|
We just saw a limit of STEM10, namely, if we are looking at
making a stem-and-leaf diagram for data based upon
a cut-point to the right of the 10's place, then we have to
multiply our values by the right power of 10, round the results, then
run STEM10, and finally interpret the results.
A similar problem occurs when we are trying to use the STEM10
program with a cut point to the left of the 10's place.
Let us look at a such data set.
As usual, we will generate a list of data on the calculator, this time using
GNRND4 with Key 1=191792204 and Key 2=80037418. That list
will be the same numbers that appear in the following table:
Thus, our problem will be to generate a stem-and-left diagram for the data in the
list above.
Figure 49
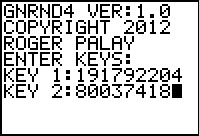 |
We start the GNRND4 program and we give it the key values.
|
Figure 50
 |
Seeing the values that we are to analyze, it is clear that we do not want to
have the cut-point between the ten's and unit's place.
Rather, it makes much more sense to have the cut-point
between the thousand's place and the hundred's place. Thus, for the first
value we would want a stem of 37 and a leaf of 8,
rounding the 764 to 800 and just keeping the 8.
This, as you may have guessed, will pose a new problem for reporting the result
because we have no "nice way" to say the the leaf 8 is really 800,
but we will try to address that later.
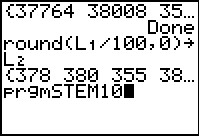
Here we will produce a new list, much as we did in Figure2 42 and 43 above, but this time we will divide
our original values by 100 in order to move the cut-point
to the location that the current STEM10 is designed to use.
The new list is again stored in L2.
Then we start the STEM10 program.
|
Figure 51
 |
We tell teh program the location of the data.
|
Figure 52
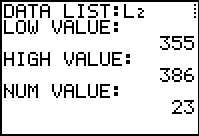 |
We review the initial display output of the program.
|
Figure 53
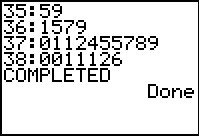 |
And here we have the output of the program. We need to re-interpret that
output because of the changes that we made in the data. As noted above,
we want to find some way to indicate that the stem value 35:
is really 35000, and the leaf value 5 is reall 500.
One way is to capture the stem-and-leaf diagram in a table such as:
all values
times 1000 | all values
times 100 |
| 35: | 59
|
| 36: | 1579
|
| 37: | 0112455789
|
| 38: | 0011126 |
This may be a bit ugly, but it is effective.
|
©Roger M. Palay
Saline, MI 48176
September, 2012