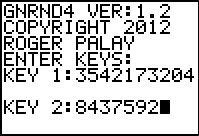
We will generate a list of data on the calculator, using
GNRND4 with Key 1=3542173204 and Key 2=8437592. That list
will be the same numbers that appear in the following table:
Thus, our problem will be to generate a stem-and-left diagram for the data in the
list above.
Figure 1
|
Here we have started the GNRND4 program and given it the two
specified keys. We finish by using the  key. key.
|
Figure 2
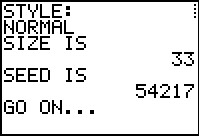 |
The program responds with Figure 2.
We continue by using the key.
|
Figure 3
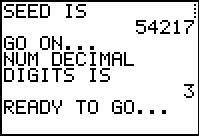 |
Figure 3 gives some more information.
We continue by using the key.
|
Figure 4
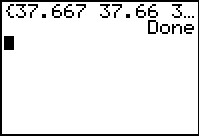 |
The program does its work generating the values, which are stored in
L1. We conclude by
pressing the key.
The calculator responds with Done.
We can see that the first two values in the list are identical to those in the table
above. We could have used the  key to scroll across the rest of the list but this is a slow
and painful process.
key to scroll across the rest of the list but this is a slow
and painful process.
Instead we will use the
 key to open the STAT
menu and the key to open the
stat editor. The result is shown in Figure 5. key to open the STAT
menu and the key to open the
stat editor. The result is shown in Figure 5.
|
Figure 5
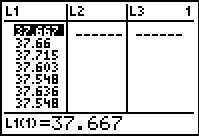 |
Here we can see the first seven (7) values in the list.
There are exactly the values given in the table above. If we wnted to
we could use the  key to scroll down the list to verify the rest of the values.
Now that we have the values in the calculator, we can use the STEMCD
program to create a stem and leaf diagram.
|
Figure 6
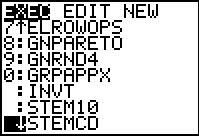 |
We use the  key to open the
program menu. Then we move the highlight down to the
STEMCD name. At that point we press
to cause the calculator to paste the desired command onto the main screen. key to open the
program menu. Then we move the highlight down to the
STEMCD name. At that point we press
to cause the calculator to paste the desired command onto the main screen.
|
Figure 7
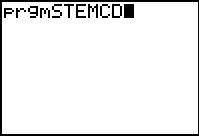 |
Once the desired command, in this case prgmSTEMCD, has been pasted
onto the main screen, we press
to start the program.
|
Figure 8
 |
The program introduces itself and then asks for the location of the data.
We indicate that it is in L1
by pressing   .
Then, to continue with the program we press
. .
Then, to continue with the program we press
.
|
Figure 9
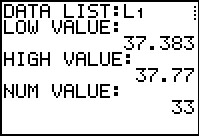 |
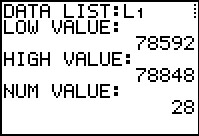
The STEMCD program reviews the data and then
gives us three values,
the minimum value in the list, the maximum value in the list, and the number of items in the list.
These are useful in helping us determine where we want to "cut" the numbers
between the "stem" and the "leaf".
For the values in our table (list) it is pretty
clear that we want to have the
"stem" be the values from the tenths
place to the left. Thus, our lowest "stem"
should be 37.3 and the highest should be 37.7.
In fact, at this point we know that we will have 5 stems and that our
diagram, without the leaf values, will be
37.3:
37.4:
37.5:
37.6:
37.7:
The progam is waiting for our signal to continue, so we press
.
|
Figure 10
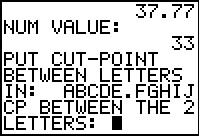 |
The program now asks us for the location of the "cut point".
It does this by giving us a pseudo-number
in the form of ABCDE.FGHIJ and asking us for
the two character sequence that marks either side of the
"cut point", CP.
|
Figure 11
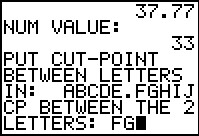 |
For the data that we are using we had determined that we
want the "cut point" to be between the tenths and
hundredth places. In the pseudo-number ABCDE.FGHIJ
that means we want the "cut-point" between the F
and the G. Therefore we respond with FG
via the sequence  
 .
Then press to continue the program. .
Then press to continue the program.
|
Figure 12
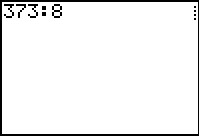 |
STEMCD clears the screen and then starts to display the stem and leaf
diagram, one line at a time. Figure 12 shows the first line,
373:8, which is what we expected, although the STEMCD
does not display the decimal point.
Press to continue.
|
Figure 13
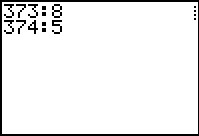 |
Now we have the second line.
Press to continue.
|
Figure 14
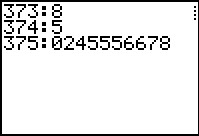 |
Figure 14 adds the third line to the display.
Press to continue.
|
Figure 15
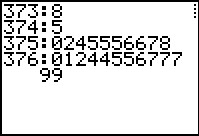 |
Figure 15 adds the fourth line to the display. In this case the line is too long
to fit on the screen so STEMCD wraps it around onto the next
line.
Press to continue.
|
Figure 16
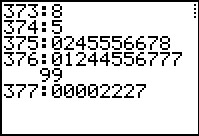 |
Now we have the fifth line.
Press to continue.
|
Figure 17
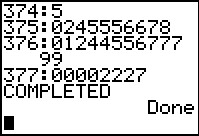 |
The program concludes by printing COMPLETED.
|
Let us consider a second example.
As usual, we will generate a list of data on the calculator, this time using
GNRND4 with Key 1=473282704 and Key 2=6878732. That list
will be the same numbers that appear in the following table:
Thus, our problem will be to generate a stem-and-left diagram for the data in the
list above.
Figure 18
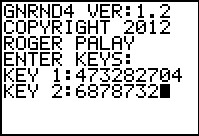 |
We start by generating the numbers given in the table above on the
calculator, running GNRND4 and entering the specified
values for the two keys.
We then use to continue the program.
|
Figure 19
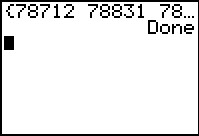 |
Figure 19 shows the conclusion of the program, having skipped over the two intermediate output
screens. We can verify that we have exactly the same values on
the calculator that we had in the given table.
|
Figure 20
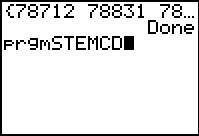 |
We use the key t go to the list of
programs, move down the list to highlight STEMCD, use
to select that program and
paste the prgmSTEMCD line on the main screen.
Then press to run the program.
|
Figure 21
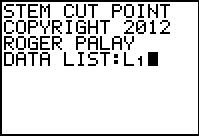 |
The program asks us for the location of the data. We use
to
tell it that the data is in L1.
Then press to continue.
|
Figure 22
 |
The program inspects the data and gives us the low and high values along with the number of values.
We see that a reasonable stem and leaf diagram would have the stems:
785:
786:
787:
788:
Thus, we want the cut point between the hundreds palce and the tens place.
Press to continue.
|
Figure 23
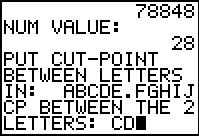 |
The program uses the pseudo-number ABCDE.FGHIJ
to request the location of the cut point.
We respond by using
 to indicate our choice of CD.
Press to continue.
to indicate our choice of CD.
Press to continue.
|
Figure 24
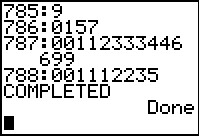 |
Figure 24 shows the completed run of the program,
after we have used the
key repeatedly to step through
each line of output.
|