- We have a population the members of which fall into two groups,
those with a particular characteristic and those without that
characteristic. (As a small aside, the population may fall
into many groups but we focus on one characteristic and
lump the rest into a group of items not having that characcteristic.)
- We are interested in the proportion, p, of the population
with the particular characteristic.
- We have a hypothesis about the "true" value of the population proportion.
That is, someone (perhaps us) claims that
H0: p = a,
for some value a.
- We will consider an alternative hypothesis which is one of the following
- H1: p > a,
- H1: p < a, or
- H1: p ≠ a.
- We want to test
H0 against H1.
- We have already determined
the level of significance that we will use for this test.
The level of significance, α,
is the chance that we are willing to take that
we will make a Type I error,
that is, that we will reject H0
when, in fact, it is true.
|
|
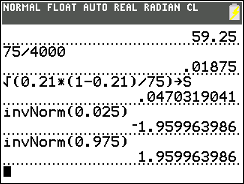
Immediately, we recognize that samples
of size n drawn from this population
with have a distribution of the
sample proportion that is a
normal with mean=p and
standard deviation=sqrt(p*(1-p)/n).
At this point we proceed via
the critical value approach
or by the attained significance approach.
These are just different ways to
create a situation where we can finally make a decision.
Of the two, the
attained significance approach is more commonly
used. Either approach gives the same final result.
|
|
Critical Value Approach
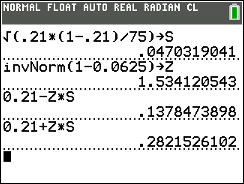
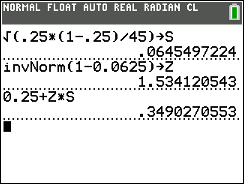
- Using the normal distribution we find the z-score that corresponds to
having the level of significance area more extreme than that z-score,
remembering that if we are looking at being either too low or too high
then we need half the area in both extremes.
- We determine a sample size n.
In doing this we need to be sure that both (n)(p)≥10 and
(n)(1-p)≥10.
- Also, we cannot sample more than 5% of the population.
That means that the size of the population must be more than 20 times n.
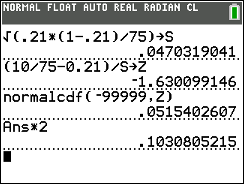
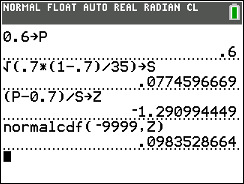
- Compute
 and use that value to
compute
and use that value to
compute  . .
- Set the critical value (or values in the case of a two-sided test)
such that it (they) mark the value(s) that is (are) that distance,
,
away from the proportion given
by H0: p = a.
- Then, we take a random sample of size n from the population.
- We compute the sample proportion,
 . .
- If that proportion
is more extreme than the critical value(s)
then we say that
"we reject H0 in favor of
the alternate H1". If the
sample proportion
is not more extreme than the critical value(s)
then we say "we have insufficient
evidence to reject H0".
| |
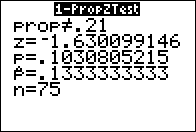
Attained significance Approach
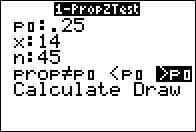
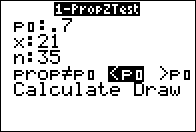
- We determine a sample size n.
In doing this we need to be sure that both (n)(p)≥10 and
(n)(1-p)≥10.
- Also, we cannot sample more than 5% of the population.
That means that the size of the population must be more than 20 times n.
- Then, we take a random sample of size n from the population.
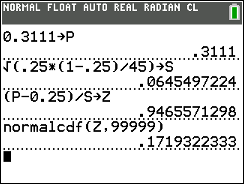
- We compute the sample proportion, .
- Compute
.
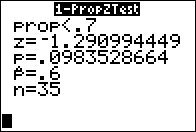
- Compute
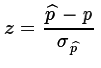 . .
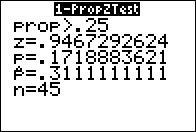
- Using the standard normal distribution,
and taking into account the alternative hyposthesis,
H1, so that we know
if we are doing a one-tail or two-tail
test,
we compute the probability of getting the value
z or a value more extreme than that.
- If the resulting probability is smaller than or equal to the
predetermined level of significance then we say that
"we reject H0 in favor of
the alternate H1". If the
resulting
probability is not less than the predetermined level of significance
then we say "we have insufficient evidence to reject H0".
|
We will work our way through an example to see this.
Assume that we have a population of values
and that the members of that population fall into two groups, those
with a certain characteristic and those without that characterisitic.
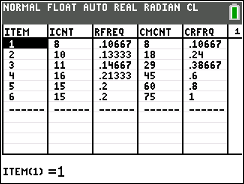
In fact we will look at the population of M&M's in standard party packages
of the candy. We will look at the proportion
of the candies that are