| Note that the TI-86 and the TI-85 have slightly different keys. This page uses the keys associated with the TI-86. The differences are in the "2nd" functions on some of the keys used here. The TI-85 keys will have the same key-face symbol unless otherwise noted. |
The following screen images trace the steps needed to generate a graph on a TI-86 for the solution to the problem given as
 and the fact that the TI-86 respresents the value TRUE by the number 1
and it represents the value FALSE by the number 0.
and the fact that the TI-86 respresents the value TRUE by the number 1
and it represents the value FALSE by the number 0.

|
We have opened the GRAPH menu in Figure 1 by pressing the  key. The calculator used to generate these screens did not have any
previously defined graphs on it. Therefore, the screen shown here
is blank except for the menu at the bottom. Had a graph been defined
earlier on the calculator, that graph would have been displayed, along with the
menu. In any case, it is only the menu that we are interested in at this point.
key. The calculator used to generate these screens did not have any
previously defined graphs on it. Therefore, the screen shown here
is blank except for the menu at the bottom. Had a graph been defined
earlier on the calculator, that graph would have been displayed, along with the
menu. In any case, it is only the menu that we are interested in at this point.
|
| We can press the  key to leave Figure 1 and move to Figure 2.
Again, the screen shown here is
empty because no graph had been defined earlier.
Had a graph been defined earlier
the function definition would have appeared here.
In that case we could use the CLEAR
key to remove to old definition (or definitions), and to
change the screen so that it appears as in Figure 2.
key to leave Figure 1 and move to Figure 2.
Again, the screen shown here is
empty because no graph had been defined earlier.
Had a graph been defined earlier
the function definition would have appeared here.
In that case we could use the CLEAR
key to remove to old definition (or definitions), and to
change the screen so that it appears as in Figure 2.
Figure 2, as shgwn, indicates that the calculator is ready for us to enter our new function. |
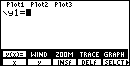
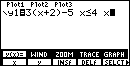
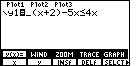
| For Figure 3 we have started to enter the problem.
We have done this via the keys
  
  
  .
Now we need to generate the "less than or equal to" sign, .
Now we need to generate the "less than or equal to" sign,
|
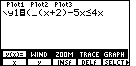
| To find the  keys. The result is Figure 4. The
TEST sub-menu has the character that we want to use.
keys. The result is Figure 4. The
TEST sub-menu has the character that we want to use.
|
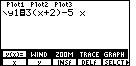
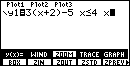
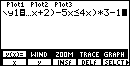
| For Figure 5 we can complete the definition by pressing
 to select the to select the
 . .
|
| In order to close the sub-menu, we press
 . This changes the display to that shown
in Figure 6. . This changes the display to that shown
in Figure 6. |
| Then, to open the ZOOM menu, we can
press the  keys to select the middle option inthe upper menu.
Figure 7 illustrates the ZOOM sub-menu.
We can press to choose the
ZSTD option from the menu.
keys to select the middle option inthe upper menu.
Figure 7 illustrates the ZOOM sub-menu.
We can press to choose the
ZSTD option from the menu.
|
| The resulting graph is shown in Figure 8.
The solution to the original problem,
Evaluating |
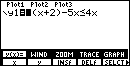
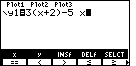
| We will make the changes to the function and then graph the new version. First,
we return to the y= screen
by pressing . This brings up the screen shown in
Figure 9. Note that the blinking cursor has been caught covering up the "3"
at the start of the expression. We want to insert a left parenthesis before the "3".
We can shift the calculator into "insert" mode by pressing the
 keys. The result is shown in Figure 10. keys. The result is shown in Figure 10.
|
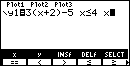
| The blinking block cursor of Figure 9 has been changed to a blinking underscore cursor in Figure 10. This indicates that we are in "insert" mode. |
| For Figure 11 we have pressed the
key. The calculator has inserted the left parenthesis before the bkinking underscore cursor.
|
| To complete the change we want to move to the right end of the
expression and add ")*3–1". We can do this by
pressing  to move the the right end, and then

 to complete the
task. to complete the
task.
To leave this figure and move to Figure 13, press
|
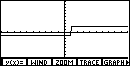
| We can now see the portion of the graph that is negative, representing values of x where the inequality is false, and the portion of the gaph that is positive, representing values of x where the inequality is true. |
PRECALCULUS: College Algebra and Trigonometry
© 2000 Dennis Bila, James Egan, Roger Palay
 to choose the
GRAPH option in the top menu.
to choose the
GRAPH option in the top menu.