| Requirements: |
| ||||||||||||||||||||||||||||||||||||||||||||||||||||||
| Create the Tableau | The tableau will hold the work we are doing. Creating a tableau in the calculator
will mean creating a matrix to hold numbers. We may well want to recreate that matrix
on paper because we have row and column headings that we simply cannot put into the matrix
on the calculator. The matrix in the calculator will have one more row than we have
inequalities. The number of columns in the matrix will be the number of variables plus the number of inequalities plus 2.
| ||||||||||||||||||||||||||||||||||||||||||||||||||||||
| Example |
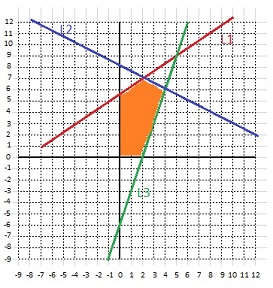
For the following inequalities
x1 + 3x2 ≤ 34 x1 + x2 ≤ 18 4x1 + x2 ≤ 60 First we create a separate slack variable for each inequality to make it an equality. This yields x1 + 3x2 + s2 = 34 x1 + x2 + s3 = 18 4x1 + x2 + s4 = 60 1x1 + 3x2 + 0s1 + 1s2 + 0s3 + 0s4 + 0z = 34 1x1 + 1x2 + 0s1 +0 s2 + 1s3 + 0s4 + 0z =18 4x1 + 1x2 + 0s1 + 0s2 + 0s3 + 1s4 + 0z = 60
 | ||||||||||||||||||||||||||||||||||||||||||||||||||||||
| The Steps |
| ||||||||||||||||||||||||||||||||||||||||||||||||||||||
| Example Continued |
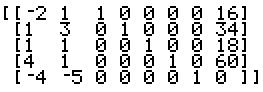
We had the following matrix:
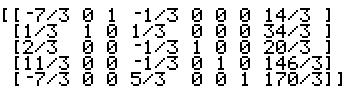 At this point we see that there is still a negative value in the final row, excluding the final column. In particular, there is the value –7/3 in column 1. Thus, we make column 1 the work column. Now we need to examine all of the positive values above the –7/3. In this case there are only three such positive values, the ones in rows 2, 3, and 4. for each of these we form the ratio of the number in the same row but final column and the positive number in the work column. Thus, we need to look at (34/3) / (1/3) which is 34, (20/3) / (2/3) which is 10, and (146/3) / (11/3) which is 13.2727. The smallest of these values is the 10 from the computation in row 3. Therefore, the 2/3 in row three column one is the new pivot element. We use the *row elementary row operation to change the pivot to 1 (i.e., multiply row 3 by 3/2). Then we use the *row+ elementary row operation to change all other values in the work column, column 1, to be 0. The result is the following matrix:  We see that there are no more negative values in the last row (of course, still ignoring the last column) so we are done. A more elaborate table display of the tableau would be:
Since we are really interested in just the original variables, we see that the values of x1 and x2 are determined. (If either one of them had not made it over to be a label on the left side of the tableau, then we would have taken itsw value to be 0.) We can confirm the value at the solution point since we know that we want x1=10, x2=8 and that makes 4x1 + 5*x2, our original objective function become 4*10 + 5*8 or 80. |
| Preprocessing | We will do a set of steps called "Preprocessing"
to convert a tableau with one or more negative values in the final column into a tableau
that has only non-negative values in the final column. If this preprocessing phase cannot reach
that goal then there is no solution and we just stop the analysis.
The steps in "Preprocessing" take place if there is at least one negative value in the final
column (excluding the entry in the final row). The steps are:
|
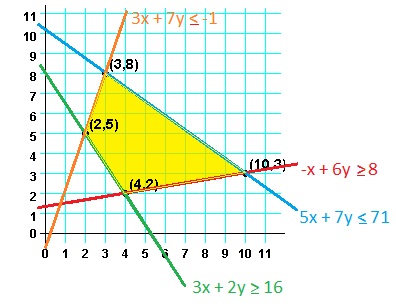
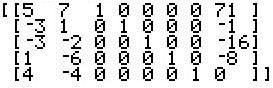
| Expanded Example | For –3x + y ≤ –1 –3x + –2y ≤ –16 x + –6y ≤ –8
We restate the objective as
4x -4y = z
  Looking at the matrix above we see that there is still a negative value in the final column, so we start the preprocessing phase over. The most negative value (indeed the only negative value) in the final column is –40/3 in row 4. Make row 4 the work column. The most negative value (indeed the only negative value) in the work row (ignoring the final column) is –20/3 in column 2. Make row 4 column 2 the pivot location. Use the *row elementary row operation to change the pivot value to 1, i.e., multiply row 4 by –3/20. Then, convert the remaining entries in the pivot column, column 2, to 1 by use of the *row+ elementary row operation. The resulting matrix is 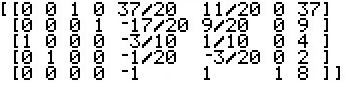 Looking at the matrix above we see that there are no negative values in the final column, so we are done with the preprocessing phase. We return to the regular (standard) Simplex Method procedures. The most negative value (indeed the only negative value) in the final row ignoring the final column is –1 in column 5. Make column 5 the work column. At this point, we need to find, for each positive value in the work column, the ratio of that positive value divided into the number in the final column nof the same row. Then we find the lowest such ratio. In our present case there is only one positive value, 37/20, in row 1 of the work column. Therefore, row 1 column 5 is the new pivot. Use *row to make that entry 1 and then use *row+ to make the rest of the entries in the work column be 0. The resulting matrix is  Looking at the matrix above we see that there are no negative values in the final row, so we are done with the Simplex Method. Our paper copy appears as
|
What if we have the same system of inequalities as above but we want to minimize the expression 4x – 4y. First, note that if we have values p, q, r, and s and we have the relations
| Expanded Example | For –3x + y ≤ –1 –3x + –2y ≤ –16 x + –6y ≤ –8
Because this is a minimize problem, our first step is to replace the
objective function with its opposite, namely –4x + 4y
We restate the objective as
–4x + 4y = z
  Looking at the matrix above we see that there is still a negative value in the final column, so we start the preprocessing phase over. The most negative value (indeed the only negative value) in the final column is –40/3 in row 4. Make row 4 the work column. The most negative value (indeed the only negative value) in the work row (ignoring the final column) is –20/3 in column 2. Make row 4 column 2 the pivot location. Use the *row elementary row operation to change the pivot value to 1, i.e., multiply row 4 by –-3/20. Then, convert the remaining entries in the pivot column, column 2, to 1 by use of the *row+ elementary row operation. The resulting matrix is  Looking at the matrix above we see that there are no negative values in the final column, so we are done with the preprocessing phase. We return to the regular (standard) Simplex Method procedures. The most negative value (indeed the only negative value) in the final row ignoring the final column is –1 in column 6. Make column 6 the work column. At this point, we need to find, for each positive value in the work column, the ratio of that positive value divided into the number in the final column nof the same row. Then we find the lowest such ratio. In our present case there are three positive values, 11/20, 9/20, and 1/10 in rows 1 through 3 of the work column. The ratios become 37/(11/20), 9/(9/20), and 4/(1/10). These evaluate to 67.2727..., 20, and 40. The lowest ratio is 20 in row 2. Make row 2 the work row. That makes row 2 column 6 the pivot cell. Use the *row elementary row operation to change the pivot cell to be 1, i.e., multiply row 2 by 20/9. Then, use the *row+ operation to change the rest of the pivot column, column 6, to be 0. The resulting matrix appears as 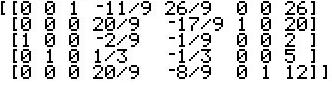 There is still a negative value in the last row, excluding the last column. Therefore, we repeat the standard process. The most negative value (indeed the only negative value) in the final row ignoring the final column is –8/9 in column 5. Make column 5 the work column. At this point, we need to find, for each positive value in the work column, the ratio of that positive value divided into the number in the final column nof the same row. Then we find the lowest such ratio. In our present case there is just one positive values, 26/9 in row 1 of the work column. Therefore, we do not even have to find the ratio, there is only one choice for a work row. Make row 1 the work row. That makes row 1 column 5 the pivot cell. Use the *row elementary row operation to change the pivot cell to be 1, i.e., multiply row 1 by 9/26. Then, use the *row+ operation to change the rest of the pivot column, column 5, to be 0. The resulting matrix appears as  Looking at the matrix above we see that there are no negative values in the final row, so we are done with the Simplex Method. Our paper copy appears as
|
©Roger M. Palay Saline, MI 48176 October, 2010