 key, and then clear the screen by pressing the
To begin, we will turn on the calculator by pressing the
key, and then clear the screen by pressing the
![]() key.
key.

|
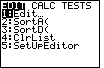
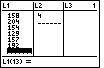
To start we will set up the "LIST EDITOR" on the TI-83. To be sure that the calculator is
in a standard form, we will move to the STAT menu by pressing the  key.
Figure 1 shows the resulting screen. This is the basic STAT menu, or actually the "EDIT" portion of the STAT
menu. key.
Figure 1 shows the resulting screen. This is the basic STAT menu, or actually the "EDIT" portion of the STAT
menu.
|
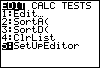
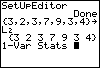
| We want to use option 5 (SetUpEditor) on this menu. We really
have two choices. We could just press the "5" key to both select and perform option 5.
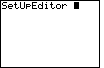
In Figure 2 we have chosen the other method, namely pressing the
 key 4 times to move the highlight to the fifth option.
Then, we can select that option, and move to Figure 3, by pressing the key 4 times to move the highlight to the fifth option.
Then, we can select that option, and move to Figure 3, by pressing the
 key. key. |
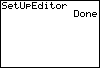
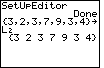
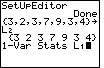
| All that we accomplished by selecting and performing the fifth option
from Figure 2 was
to write SetUpEditor on the screen as a command. This can be seen in Figure 3.
Now, to perform this command, we need to press the key
again. |
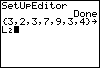
| Figure 4 shows the calculator response to the SetUpEditor command, namely "DONE" on the right side of the screen. The real work of the SetUpEditor can not be seen on this screen. Rather, SetUpEditor has placed the six standard Lists [L1, L2, L3, L4, L5, and L6] into the List editor. We will see these lists in the List Editor in Figure 8. However, first let us create a list and store it into L2. |
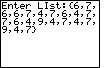
We want to examine the numbers 3, 2, 3, 7, 9, 3, and 4. To do this on the calculator we need to put these numbers into a list. They can be put into any list, but we might as well use one of the pre-defined lists on the TI-83.
| We place our numbers into L2 by creating a list and then assigning it to
L2. We create the list by enclosing the values
between braces. To generate the left brace press the 
 key sequence.
Then we enter the numbers, separated by commas as key sequence.
Then we enter the numbers, separated by commas as


 . We finish the list with a closing right brace via
the . We finish the list with a closing right brace via
the
 key sequence.
And we store our list into L2 by
pressing the key sequence.
And we store our list into L2 by
pressing the  keys.
This should leave the screen as shown in Figure 5. keys.
This should leave the screen as shown in Figure 5. |
| Figure 5 shows the command as it was set up on the screen. Of course, nothing has happened
in Figure 5 because we have not told the calculaltor to perform the operation. We do that
by pressing the key. The visible result is shown in Figure 6.
The action that we can not see here is that the list of numbers has been stored in
L2.
|
|
For Figure 7 we return to the STAT menu via the key. This time
we want to perform option 1: EDIT..., and it is already highlighted.
Therefore, we can press the 1 key, or the key, which we do to
move to Figure 8.
|
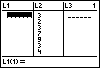
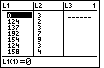
| Caution: Figure 8 may not completely correspond to the screen
on your calculator. The calculator used here did not have any values assigned to lists
L1 and L3. If your calculator has values in those lists,
then the first and third columns will have numbers in them, rather than being blank. In preparation
for Figure 9, if you have numbers in the L1 column, delete those numbers by
repeatedly pressing the  key. key.
The second column in Figure 8 holds the list of values that we just entered. Now, we
want to put a new list into L1. We could get out of the editor
and enter the list in the same way that we entered
L2.
However, in this case we will enter the list here, in the editor. As noted in the paragraph above,
if you already have a list in L1 you can delete an item
by pressing the |
We want to place the list of values
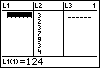
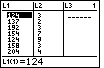
| In Figure 9 we have started the process by pressing the
 keys.
The number 124 appears at bottom of the screen as part of the line
L1(1)=124. The number will not be put into the list until we
press the key, which we do to move to Figure 10. keys.
The number 124 appears at bottom of the screen as part of the line
L1(1)=124. The number will not be put into the list until we
press the key, which we do to move to Figure 10.
|
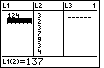
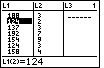
| The result of the actions given above is shown in the first column in Figure 10.
The number 124 has been placed into position 1 of the L1 list.
In addition, Figure 10 shows that we have started the process of entering the
next number, 137, into the list. We have pressed the
|
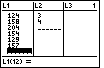
| Figure 11 shows the result not only of entering the 137,
but also of continuing the process
by entering the values 192, 154, and 124.
In addition, Figure 11 shows that the next value,
158, is ready for input as the sixth item in the list.
This time, instead of the ENTER key, we will use the
key to accept the 158 value and move to the
next list item.
That key provides an alternative method for signalling that the value
that has been entered at the bottom of the screen can be placed into the list.
|
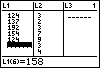
| Figure 12 shows the resulting display after all of the items have been entered.
The prompt at the bottom of the screen is waiting for the 11th item, but there were only
10 items. We are done entering the data. We press the
key to leave Figure 12 and move to Figure 13.
|

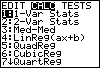
| Figure 13 is merely a repeat of the STAT menu, with the EDIT submenu selected.
We want to look at the CALC submenu. Therefore, we press
the right arrow key,  , to move the highlight onto the CALC option,
as is shown in Figure 14. , to move the highlight onto the CALC option,
as is shown in Figure 14.
|
| Figure 14 is a display of the CALC submenu for the STAT menu.
We are actually interested in looking at the one variable statistics command,
which happens to be the the first choice of this menu.
We can press either the ENTER key or, as was done here, press the key
to select the 1-Var Stats option.
|
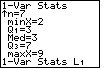
| Selecting the #1 menu choice in Figure 14 produces the command in figure 15. The 1-Var Stats command requires that we follow the command with the name of a list of values. |
| To produce Figure 16 we have pressed the
keys to generate the name
L1. Now the command is complete. This command instructs the
calculator to produce the basic statistics for the values stored in
the list L1. We finish Figure 16 and move to Figure 17 by
pressing the key.
|
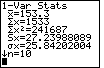
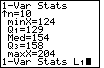
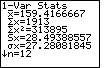
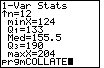
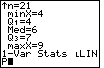
| Figure 17 shows us some of the basic statistics for the values in
L1. We start with Briefly, the other items on Figure 17 are
We note that there is an arrow pointing down next to the n=10. That arrow indicates that there is more
information to be presented, and that we should use the cursor down key,
|
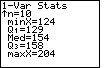
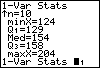
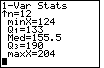
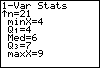
| To move from Figure 17 to Figure 18 we have pressed the
key five times to show all the rest of the data.
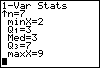
The calculator is reporting that the minimum value in the list was 124 (minX=124),
that the median value for all of the items in L1 is 154 (Med=154),
and that the maximum value in the list was 204 (maxX=204). Two other values are given, namely, the first quartile (Q1=129) and the third quartile (Q3=158). The median is the second quartile point, where 50% of the values are below the median and 50% are above it. The first quartile point, Q1, has 25% of the values below it and 75% above. The third quartile point, Q3, has 75% of the values below it and 25% above. |
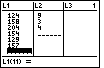
At this point we would like to go back and obtain the basic statistics on the values stored in L2. To do this we need to return to the 1-Var Stats command. There are many ways to accomplish this. In the sequence given below we will simply recall the last command and then modify it to reference the L2 list.
| We recall the last command by pressing the
keys. This redisplays the last
command at the bottom of the screen, as is shown in Figure 19. Unfortunately, that command
references L1 and we want to look at the values in
L2. Note that the blinking cursor is positioned after the command.
|
| We press the  key to move the cursor
back, to the left, one symbol. Note that it is now on the L of
L1. That is because L1 is really one symbol.
At this point we are ready to call for the L2 symbol by
pressing the keys, which will produce
the screen in Figure 21. key to move the cursor
back, to the left, one symbol. Note that it is now on the L of
L1. That is because L1 is really one symbol.
At this point we are ready to call for the L2 symbol by
pressing the keys, which will produce
the screen in Figure 21.
|

| Here we have generated the desired command, the command to generate the basic
statistics for the values in L2. All that
remains is to press the key to cause the calculator
to perform the command. We do that to move to the next Figure.
|
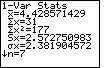
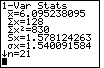
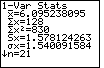
| Here are the basic statistics for the values that we stored in
L2 at the start of this page. We see that the mean
is 4.428571429 ( |
| As before, the TI-83 provides more statistical information than can be seen on one screen.
Figure 23 shows the rest of this information. We used the
key five times to shift the display
so that we can see this information. Here we can see that the median
is 3 (Med=3). |
We have seen the mean and median values for the lists stored in L1 and L2. For the purpose of demonstration, we will assume that we need to add two more numbers to the L1 list. In particular, we want to add 188 as the first element of the list and 192 as the last element of the list. Once this has been done, we will want to recompute the basic statistics for the L1 list of values.
| To get to Figure 24 we have pressed the
key to open the STAT menu (which we have seen in Figures 1, 7 and 13)
and then we pressed the key to initiate the
preselected Edit... option. This will open the screen seen in
Figure 24 with the first item in L1 highlighted at the
top of the left column and
that same item repeated at the bottom. We want to insert a new value at the start of this
list. We do this by pressing the
keys. This will
produce the display in Figure 25.
|
| Here we see the result of using the insert command. The old values in L1 have been shifted down one place and a new value, 0, has been added to the start of the list. Furthermore, that new value is highlighted at the top and, therefore, it is displayed at the bottom, identifying it as item 1 in L1 . |
| We did not want the new item to be 0. Rather we wanted to add the value 188.
Therefore, we will change the 0 to 188 by pressing the keys
 and
then to accept the new value. This leaves the
display as in Figure 26. and
then to accept the new value. This leaves the
display as in Figure 26.
|
| To add 192 to the end of the list we need to move the highlight down to the
end of the list. We do this by using the
key over and over until we reach the bottom. There were 10 items in the list. We just inserted
a new first item, 188, so now there are 11 items. We have moved the highlight down
to the end of the list marker (.......) and we see at the bottom of Figure 27
the text |
| To move from Figure 27 to Figure 28 we enter the new number,
and press to accept the new value. The screen in Figure 28
shows that the new value is now in the list, and the calculator is ready to add another
value in position 13. We do not want to add any move values. Instead we want to recalculate the statistics for L1. |
| We want to create the command 1-Var Stats L1.
There are many ways to do this. For example, we could go back to the STAT menu,
shift it from the Edit submenu to the Calc submenu, select the first option and then append the
name of the list, L1. However, we recently gave exactly the command that
we want to give now (we did this back in Figure 16. In fact, we have only given one other
command since then, in Figure 21 (opening menus and selection menu options does not count
as giving a command).
First we quit the editor via the two
key sequence |
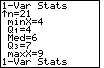
| Having recalled the command in Figure 29, we press
to perform that command. The result is given in Figure 30.
Note that this screen shows the new basic statistics for the newly changed
L1 list. We can compare these values to the ones in Figure 17.
Everything has changed. We now have twelve items (n=12) and the
mean is now approximated by key five times. This will shift the screen
to be as shown in Figure 31.
|
| We can see the new median for the values in L1 (Med=155.5). Remember that the median is the mid-point of the data. With the two new values in the list, and given that there are an even number of items in L1, we determine the median by taking the average of the two middle items in the sorted list. In this case, that will be the average of 154 and 157. |
In the first 31 Figures we have seen examples of finding the mean and median of lists of numbers. To find the median, the calculator must be sorting the values in the lists, but the TI-83 does not show us the sorted list. Instead, the calculator merely reports the minimum, maximum, median, and 1st and 3rd quartile points.
We have not seen any method for finding the mode of the data values in a list. The built-in features of the TI-83 do not produce the mode. We can augment those features, however, by programming the calculator. The program COLLATE has been created to help out here. The following Figures will use this program. The program must be placed into your calculator before you can use it. COLLATE is available here for downloading to a PC or Mac from which it can be transmitted to the TI-83 via the TI-GraphLink or TI-Connect program and cable. (It may be best to "right click" on the link and save the file to disk. Some problems have been noted when using Netscape to do this.) Alternatively, the program can be transfered from one TI-83 to another, if you know someone who has the program. Or, it is possible to enter the program. A listing of the program is given in the COLLATE listing page.
Let us investigate the use of the COLLATE program.
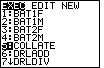
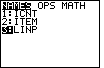
| We press the  key to open the PROGRAM menu.
This menu changes as new programs are entered into the calcualtor. The calculator
used to create Figure 32 had a number of programs in it. COLLATE was the fifth program
listed. We have moved the highlight down, via the
key, to that fifth item. At that point we can
press the key to move to Figure 33. key to open the PROGRAM menu.
This menu changes as new programs are entered into the calcualtor. The calculator
used to create Figure 32 had a number of programs in it. COLLATE was the fifth program
listed. We have moved the highlight down, via the
key, to that fifth item. At that point we can
press the key to move to Figure 33. |
| All that we accomplished in the previous step was to place the command
again to actually
run the COLLATE program. |
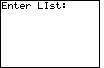
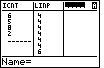
| The COLLATE program starts by clearing the screen and asking us for the list of values to be used. |
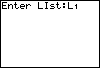
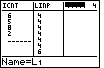
| If we want COLLATE to process the values that we have stored in
L1, then we press
to generate the response
L1 seen on Figure 35.
Then we can press the key to accept our response, and move to Figure 36.
|
| COLLATE will do a number of things as it examines each of the items in our
list. Once COLLATE is through examining the list, it will start its display.
Figure 36 shows that first display of results. According to Figure 36, COLLATE
found 12 items in our list, and COLLATE determined that there were 9 distinct values.
The pattern of dots at the upper right corner of the screen (they will be moving on the TI-83)
indicates that the calculator has "paused" so that we can read the screen. We can have the program move on by
pressing the |
| Now the COLLATE program goes ahead and starts to list,
in ascending order, each distinct item found
along with the number of times it found that value.
If you were making a frequency distribution table, this screen would give you the
values needed for the first row of that table.
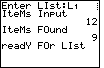
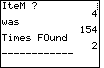
Thus, Figure 37 tells us that the first item
in our sorted set of values is 124 and that it was found 2 times in the list.
Press to move to the next screen. |
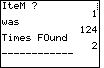
| Accordng to Figure 38, the second value in the sorted list is 129 and it was found 1 time. This would be the second row of a frequency distribution table, and so on. |
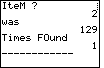
| Accordng to Figure 39, the third value in the sorted list is 137 and it was found 1 time. |
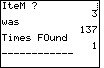
| Accordng to Figure 40, the fourth value in the sorted list is 154 and it was found 2 times. |
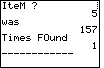
| The fifth value in the sorted list is 157 and it was found 1 time. |
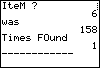
| The sixth value in the sorted list is 158 and it was found 1 time. |
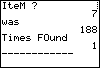
| The seventh value in the sorted list is 188 and it was found 1 time. |

| The eighth value in the sorted list is 192 and it was found 2 times. |

| The ninth value in the sorted list is 204 and it was
found 1 time. And we press
to move to the next screen. |
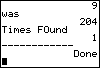
| Figure 46 shows the word "Done" on the lower right side of the screen. This is an indication that the COLLATE program has completed. |
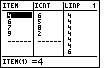
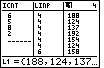
The COLLATE program, by the time it has finished, does much more than just display the results shown above. That program creates three new lists. The first is called LINP and it holds a sorted copy of the list that we gave to the COLLATE program. The second list is called ITEM and it holds the different distinct values that were found in LINP. The third list is called ICNT and it holds a count of the number of times each corresponding value in ITEM appears in LINP. That is, ICNT holds the frequency with which values in ITEM appear in LINP. In addition, COLLATE uses the SetUpEditor command to change the way that the list editor appears.
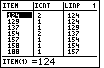
| We have arrived at Figure 47 by pressing the
key to open the STAT menu, and then pressing the
key to select the Edit... option. This is the same sequence that
produced Figures 8 and 24, but now the display is different. Instead of
showing L1, L2, and L3,
Figure 47 shows ITEM, ICNT, and LINP. This is a change caused by
COLLATE and its use of the SetUpEditor command. Figure 47 confirms the text description given above. LINP is the sorted version of L1, the list that we input to COLLATE. ITEM does hold the distinct values that are in L1, and, therefore, are in LINP. And, ICNT holds the frequency with which values in ITEM appear in L1. |
| In Figure 48 we have used the key to move
to the botom of the ITEM values, just to confirm what we have seen in Figure 47. |
| We will leave the editor by pressing the
keys  and then we will recall the command to run the COLLATE program by
using the keys .
This will produce Figure 49. Pressing again
will start the COLLATE program.
and then we will recall the command to run the COLLATE program by
using the keys .
This will produce Figure 49. Pressing again
will start the COLLATE program. |
| Here we see that the program has cleared the screen and has asked for a new list to
process. Rather than enter the name of a list, we will enter a new list to accept that list
and to continue processing via the program. |
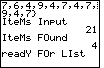
| COLLATE has processed the list. It has found that we have 21 items in the
list, but that there are only 4 distinct values.
We press to move to the next screen. |
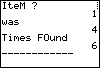
| Figure 52 informs us that the first value was 4, and that it appeared 6 times.
Press to move to the next screen. |
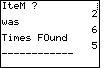
| The second value was 6, and it appeared 5 times. |
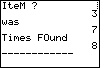
| The third value was 7, and it appeared 8 times. |
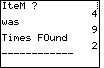
| The fourth value was 9, and it appeared 2 times. |
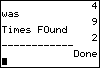
| Having pressed to leave Figure 55, the display shows
us, via the word Done that the program is completed.
|

| We use the key sequence
to open the
STAT menu and to start the Edit... option.
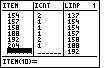
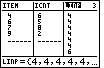
Figure 57 shows us the three lists, and again we can confirm that
ITEM and ICNT really provide a frequency table for the values in LINP,
which is a sorted version of the list that we entered into the program. |
We have seen two different ways to give COLLATE a list. In the first case, we created a list in L1 and then supplied the name L1 to the COLLATE program. In the second case, we simply entered the list into the program, as was shown in Figure 50. Both methods work. The first has the advantage that the original list is in the calculator and it can be changed if need be (we experienced a change to the L1 list earlier). The second has the advantage that it requires no prior work. With the second approach you can just run the program and give it the list. The drawback is that the original list is not saved anywhere. However, COLLATE does save the sorted version of that list, in LINP, and you can edit or use LINP if need be. The Figures below will demonstrate this as well as expand on the use of the 1-Var Stats command.
Let us obtain the basic statistics for the list of values that we just put into the COLLATE program. We will not have to re-enter those values because we really have them in the calculator twice already. We have them in the LINP list, and we have them in the combination of the ITEM and ICNT lists, which provide the distinct items and their associated frequency. Earlier, in Figures 16, 21, and 29, we demonstrated the 1-Var Stats command where we followed the command by the name of a single list. If we follow the 1-Var Stats command by two lists, separated by a comma, then the calculator understands that the first list holds the values, and the second list holds their frequency. This is the perfect case for our two lists, ITEM and ICNT.
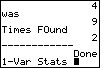
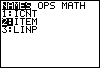
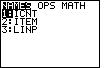
| For Figure 58 we want to create the 1-Var Stats command.
We do this by moving to the STAT menu via the
key, then moving to the CALC submenu via the
key, and finally selecting the desired option via the
key. |
| Now we want to append the name of the ITEM list to the command. We can do this
by moving to the LIST menu via the
keys. Figure 59 shows the named lists that are
on this calculator. We want to select the
ITEM list, so we will move the highlight to the second item by pressing
. |
| To move from Figure 59 to Figure 60, press the
key to select the highlighted name in Fugure 59.
We will then press the
key to enter the required comma. Note in Figure 60 that the calculator has appended
a modified version of the list name to the command.
The name of the list, ITEM, has been preceded by a small L
to form the name LITEM.
The TI-83 requires this small L before any named list.
It is not on the keyboard, but it is available
at the end of the OPS submenu of the LIST menu.
Fortunately, whenever we select a list name from the LIST NAMES menu the TI-83
automatically fills in the L.
|
| To finish the command we need to append the ICNT name. We return to the
LIST menu via the
keys. The desired list is already highlighted.
Therefore we need only press to really choose that
name. This will produce Figure 62. |
| The command is now complete. Again the TI-83 has inserted the required
L before the name ICNT.
We press to perform the command and produce the
statistics shown in Figure 63.
|
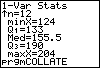
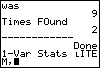
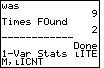
| The most important thing to note in Figure 63 is count of values, n=21. Remember that there are only 4 items in ITEM. This should confirm that our 1-Var Stats command really used both ITEM and ICNT, with ICNT supplying the frequency for values in ITEM. |
| Figure 64 shows the screen after using the
key five times to display
the rest of the basic statistics. |
| Starting with Figure 65 we will do the 1-Var Stats statistics
on the LINP values, in order to confirm that they are the same as the statistics
that we have just seen in Figures 63 and 64. To do this we generate
another 1-Var Stats command by pressing the
, ,
and keys. That should leave the display as in Figure 65.
Then we will need to append the desired list name.
|
| We move to the LIST menu via the
keys, and move the highlight to LINP via two presses of the key.
Then, we move to Figure 67 by pressing the key.
|
| In Figure 67 the command has been created.
We press the key to perform it. |
| Figure 68 shows the statistics generated by processing the LINP values. The values in Figure 68 are identical to those in Figure 63. |
Having demonstrated the COLLATE program, there is one detail tht we should wrap up here. At the very start of this presentation we issued the SetUpEditor command. That command, when given without any other values, sets the list editor to hold the standard lists, L1 through L6. The COLLATE program gives its own version of the SetUpEditor command. It looks like
All of this raises the question, how can we add an existing list to the list editor? One way would be to reform and issue a new SetUpEditor command. For example, to add L1 to the editor while leaving ITEM, ICNT, and LINP in it, we could form and issue the command
| We start by opening the list editor via the
keys. This should produce Figure 69.
|
| In Figure 70 we have moved the highlight to the right via two
presses of the key, and to the top via the
 key. key.
|
| Now, if we move to the right one more space,
by pressing the key again, the display will change to that
shown in Figure 71. Here the calculator is waiting for the name of
a list to be placed into the editor. The calculator is already in alphabetic mode as
indicated by the A in the upper right. If we enter a name it will show up in the
space at the bottom of the screen until we have finished. |
| The list that we want to add to the editor is L1.
Therefore, all we need to do is to
press the keys to
generate the L1 name at the bottom. This is the
situation shown in Figure 72. |
| Finally, to produce Figure 73, we press the
key to accept our value. The calculator now displays the
additional list, and it indicates that this is the 4th list in the editor by placing the
4 in the upper right corner of the screen.
|
©Roger M. Palay
Saline, MI 48176
November, 2010