All of that information gave us a better "feel" for the data. That is the goal of Descriptive statistics.
This is a basic statistics course. We will be introducing you to the essential concepts of statistics. The course really has two parts: Descriptive Statistics, and Inferential Statistics. However, in order for us to talk about Inferential Statistics we will need to have a common understanding of some basic Probability concepts. Therefore, between the Descriptive and Inferential parts of the course we will cover Probability.
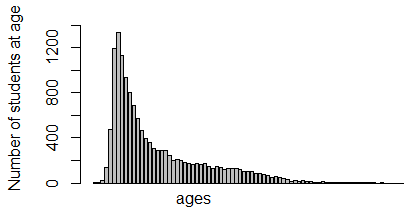
Following on with our example, after some work on my part, I can tell you that for a particular semester we had 35,856 registrations for credit courses generated by 13,856 different students. That does not tell you much about the data. However, I can also tell you that, although 71 of these students did not have a recorded birthdate, the remaining 13,785 students had an average age of 28.67 and a median age of 24. Those values, the mean and the median, are measures of central tendency. They give us a feel for the middle of the data. In particular, we now know that half the students are 24 or younger and half are 24 or older. Also, since the average age is higher than is the median age, we get the sense that there must be some "really old" students to pull up that average age.
Now we could "learn" more about our data if we are told that the youngest student
was 13 years old and the oldest is 91 years old. We get a better feel if we are told that
1/4 of the students are 20 or younger (and 3/4 are 20 or older) and that 3/4 of the
students are 35 or younger (1/4 are 35 or older).
Knowing that 1333 of the students are 19 years old, and that that is the
highest number for any age, tells us even more.
We get even a better "feel" for the data if we have a picture of it as
in the following bar chart:
All of that information gave us a better "feel" for the data. That is the goal of Descriptive
statistics.
On the other hand, let us say that we have created an interview process designed to get some measure of a person's willingness to support public transportation. That process, which takes about 20 minutes for each person interviewed, costs about $42 for each such interview. We would like to determine the extent to which WCC credit students are willing to support public transportation. We could put all 13,856 credit students through the process but that would take in excess of 4,600 hours of interviewing and cost well over half a million dollars. That is too much time and too much money! However, we could ask some relatively small number of WCC credit students to participate in such interviews, and then, based upon the results derived from those students we could "infer" that the general credit student body has the same view of those public transportation issues as we found from the smaller group. That is the essence of inferential statistics. We look at the results obtained from a smaller group and, from those results, we "infer" things about the larger group.
The large group is called the population and the small group is called the sample. As much as possible, we want the sample to be representative of the population. There are many ways to select the sample, i.e., choose the credit students who will be in the sample. We will need to learn about and consider the benefits and pitfalls of different selection criteria.
Clearly if we have access to all of the data, as we did in the discussion of descriptive data, then there is no need to look at samples and infer anything from them. However, there are many cases where we just cannot get or do not want to get data from the entire population.
Consider a second example. Let us say that we are manufacturing some item that we will call a widget. Given the nature of our widgets, there is a certain amount of variability in terms of the strength of each unit. We want to be sure that a high percentage of our widgets can withstand, with only minor damage, being dropped 8 feet onto a concrete floor. Clearly, we cannot test each widget that we make; they would all be damaged, to some extent, by the fall. Rather, we can take a sample of the widgets, drop them, and see how many of the samples withstand the fall, possibly with some scratches but still working. From the proportion of "successes" in our sample, using inferential statistics, we can make some pretty good guesses at the proportion of the rest of our widgets that would "survive" a fall if they had one. Again, we look at the results obtained from a smaller group and, from those results, we "infer" things about the larger group.
©Roger M. Palay
Saline, MI 48176 September, 2015