Mathematical Computation: Linear Regression and Correlation Coefficient

Return to Topics page

Interest in learning or even seeing the process of calculating the intercept and coefficient for a linear regression directly from the data values drops off as soon as we have software to do the work for us. The same is true for the process of finding the correlation coefficient. For example, consider the data values given in Table 1.
With just these few commands in R
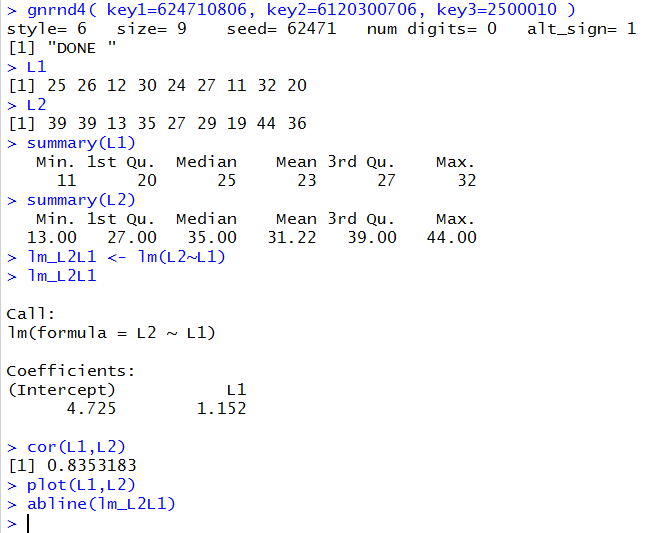
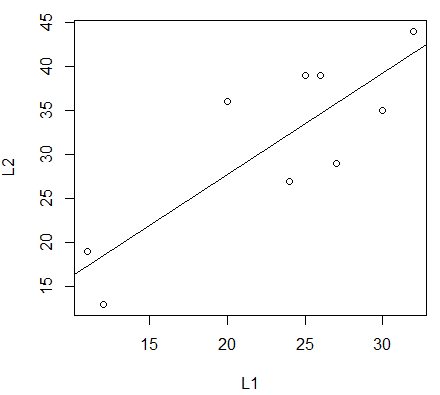
gnrnd4( key1=624710806, key2=6120300706, key3=2500010 )
L1
L2
summary(L1)
summary(L2)
lm_L2L1 <- lm(L2~L1)
lm_L2L1
cor(L1,L2)
plot(L1,L2)
abline(lm_L2L1)
we generate the data, display the data and summaries of the data, compute and display the intercept and coefficient for the regression equation, compute and display the correlation coefficient, and display a plot of the points along with the regression line.

Figure 1 shows the console output of those commands.

Figure 1

Among other values displayed, Figure 1 gives us the information to say that the regression equation is y=4.725+1.152x and the correlation coefficient is 0.8353183, a value that indicates that the model explains about 70% of the variation in the data. R has done all of the computations for us.

Figure 2 shows the resulting plot where we can see the spread of the points along the regression line.

Figure 2

The goal of this page is to define and then walk through the computations that had to be done to find the regression equation and the correlation coefficient.

We start with a few definitions.
  1. The data is in (x,y) pairs.
  2. There are n pairs of values.
  3. The regression equation has the form y = a + bx, where a is the intercept and b is the coefficient of the independent variable x.
  4. Define Sumx to be the sum of the x values.
  5. Define Sumy to be the sum of the y values.
  6. Define Sumx2 to be the sum of the squares of the x values.
  7. Define Sumxy to be the sum of the product of the x and y values.
  8. Define Sumy2 to be the sum of the squares of the y values.
Then we can create a table of values to help find all of the sums just defined.

An extra topic

You may have noted that the numerator for our expression for b is identical to our numerator for our expression for r. Furthermore, the denominator for our expression for b is part of the exression for r. With a little algebra, see the extra topic page, we can determine that an alternative expression for b is
where r is the correlation coefficient, sx is the standard deviation of the x values, and sy is the standard deviation of the y values. This, of course, is a much easier computation if we are given those two standard deviations and the correlation coefficient. A typical trick question on AP Stat tests requires one to use this computation. It is a trick because in real life if we had all of the values that we need to compute the correlation coefficient then we would already have all the values that we need to compute the value of b, the slope of the regression equation. On the other hand, if we are using R, computing a and b for our y = a + b*x is just using the the lm( ) function and finding the correlation coefficient is just using the cor( ) function.
Return to Topics page
©Roger M. Palay     Saline, MI 48176     November, 2015