Descriptive Statistics: Population vs. Sample
Return to Topics page
In the arrangement of web pages for this course,
this page presents no new material.
It is provided here
because after we start seriously talking about
samples versus populations,
it make sense to review how we name and apply
certain descriptive measures.
We distinguish between population and sample characteristics
by referring to population characteristics as population parameters
and sample characteristics as sample statistics.
Thus, the mean of a population is a parameter of that
population, but the mean of a sample is a statistic
of that sample.
Beyond that distinction
there is no difference in the naming or computing
for the
measures mode, the median,
the range, and the quartiles.
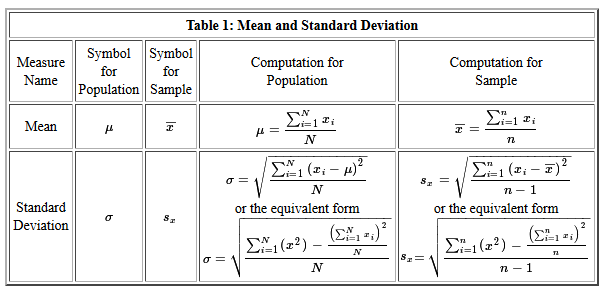
The mean of a population, μ, has
a different symbol from the one used for the mean of a sample,
 ,
however the computation of each is the same.
Standard deviation has both
different symbols, σ for a population
and sx for a sample, and
slightly a slightly different formula.
These differences are presented in the following table.
,
however the computation of each is the same.
Standard deviation has both
different symbols, σ for a population
and sx for a sample, and
slightly a slightly different formula.
These differences are presented in the following table.
As an example, we start with the data in Table 2:
Figure 1 holds the console image of running the commands:
gnrnd4( key1=740587104, key2=0002300357 )
L1
mean(L1)
summary(L1)
Figure 1
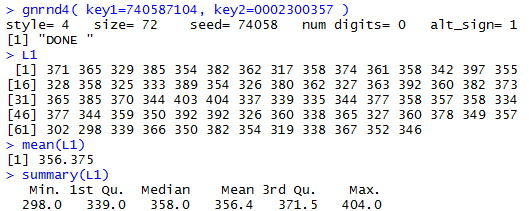
The values in Table 1, and now in L1 in
our R session, could be a population or they could be
a sample. In either case, the command mean(L1)
displays the value of the mean of those
values. If Table 1 represents a
population then we would say
μ = 356.375 but if those
value represent a sample then we would say
= 356.375.
Figure 1 continues with the summary(L1)command.
The result also displays the mean
but with fewer significant digits. Of course,
the other values in that display have the
same meaning independent of the values
being a population or a sample.
To find the standard deviation of the values in Table 1
we use the sd(L1) command as shown in Figure 2.
Figure 2
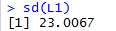
The result, 23.0067, assumes that the values in Table 1
are from a sample. There is no way to
tell the sd() command that you want the
values to be considered a population.
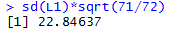
If we do want the standard deviation for a population
we can just multiply the sd() result by sqrt((N-1)/N)
where N is the number of values in the table.
Table 1 has 72 values in it so we use the
command sd(L1)*sqrt(71/72) to compute
the standard deviation of the values assuming they
are from a population.
The result is shown in Figure 3
Figure 3
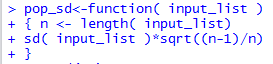
You may recall that in our earlier page discussing this issue we
developed a function to do our work for us.
The code of that function was
pop_sd<-function( input_list )
{ n <- length( input_list)
sd( input_list )*sqrt((n-1)/n)
}
Figure 4 shows the definition of the function in our R
session.
Figure 4
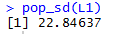
Once the function is defined we can use it to compute the
population standard deviation by just calling the function as in
pop_sd(L1). Figure 5 shows the use of that command.
Figure 5
Return to Topics page
©Roger M. Palay
Saline, MI 48176 November, 2015