The Blumenkopf Distribution
Return to Topics page
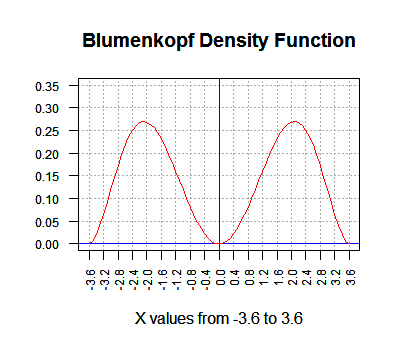
The Blumenkopf Probability Density Function is show in the following figure:
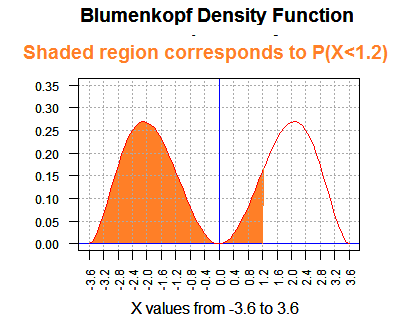
 The table given below presents the probability that a random variable X is less than a
a specific value.
That is, for a given value, say, 1.2, the P(X<1.2)=0.5703, the area of the shaded region in the following
figure.
The table given below presents the probability that a random variable X is less than a
a specific value.
That is, for a given value, say, 1.2, the P(X<1.2)=0.5703, the area of the shaded region in the following
figure.
Return to Topics page
©Roger M. Palay
Saline, MI 48176 December, 2015