We need to start with some data.
We will generate a list of data on the calculator using
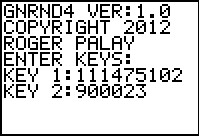
GNRND4 with Key 1=111475102 and Key 2=900023. That list
will be the same numbers that appear in the following table:
Thus, our problem will be to generate a relative frequency table for the data in the
list above.
Figure 1

|
We start the GNRND4 program. [See the Frequency Table page
for more details on these steps.]
|
Figure 2
 |
We enter the specified keys.
|
Figure 3
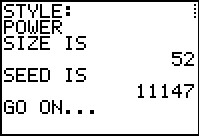 |
The program responds with two screens of information, this being the first.
|
Figure 4
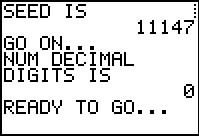 |
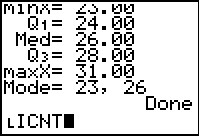
Here is the second information screen.
|
Figure 5
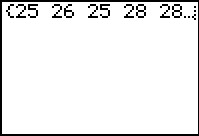 |
Figure 5 shows the resulting list.
This is really the contents of the list L1.
We can only see part of the list here, although we could use the
 key to scroll over to see more values.
We also note taht the program is still running by observing the little dots in the
upper right hand corner of the screen.
We signal that we want the program to end by pressing
the key to scroll over to see more values.
We also note taht the program is still running by observing the little dots in the
upper right hand corner of the screen.
We signal that we want the program to end by pressing
the  key. key.
|
Figure 6
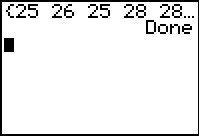 |
Now the program has finished. Note the Done message displayed when the program completes.
|
Figure 7
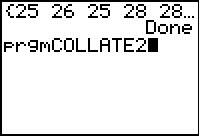 |
Our next step is to use the COLLATE2 program
to build a frequency table, among other things. To do this we
select the COLLATE2 program from the list of programs, abd paste the command onto the main screen, as shown in Figure 7.
[If you need more instruction on this,
see Figure 34 in on the Frequency Table page.]
|
Figure 8
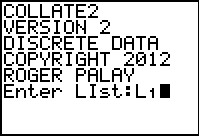 |
We start running that program. It clears the screen. Then it asks us for the list of values to use.
In Figure 8 we have responded with L1 by pressing the sequence
  . We submit this response by
pressing the key. . We submit this response by
pressing the key.
|
Figure 9
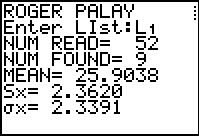 |
COLLATE2 process the information in L1 and then it starts its display of results.
The program is in a "Pause" mode in Figure 9 so that we can read the values before they scroll off the screen.
On this screen we do note that there were 9 different values found
and that there were 52 values in our original list.
We press the key to continue onto Figure 10.
|
Figure 10
 |
Figure 10 shows the rest of the out put from the program. Again, the progam is in "Pause" mode, so we press the
key to move forward.
|
Figure 11
 |
Now the program is done. One of the tasks that the program accomplihes behind the scenes is taht
it creates some new lists, namely LITEM,
LICNT, and LLINP, to
hold, respectively, the different ITEMs found in the original list,
the COUNT of the different items found in the original list,
amd the values in the original list sorted into ascending order. COLLATE2
also modifies the STAT Editor to display these lists.
|
Figure 12
 |
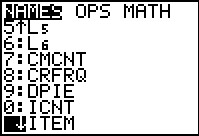
We use the  key to open the STAT menu, shown in Figure 12.
From that menu we select the first option to
open the STAT Editor. We do this by pressing either the key
or the key. key to open the STAT menu, shown in Figure 12.
From that menu we select the first option to
open the STAT Editor. We do this by pressing either the key
or the key.
|
Figure 13
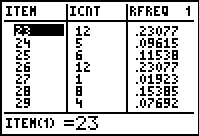 |
Figure 13 shows the data in the first 7 rows of the specified lists.
What we want is a new list with values that are 1/52 of same values that are in
LICNT.
We will exit the STAT Editor to do this.
We exit via the  key sequence. key sequence.
|
Figure 14
 |
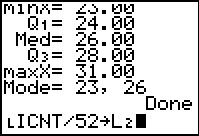
We are returned to the main screen. The command that we want to produce is
 . To do this we need to get the
LICNT name on the screen. We can find that
name in the LIST menu. We open the LIST menu by
pressing the sequence . . To do this we need to get the
LICNT name on the screen. We can find that
name in the LIST menu. We open the LIST menu by
pressing the sequence .
|
Figure 15
 |
We can see the LIST menu in Figure 15. we have moved the highlight down tot he desired list.
We can select taht list by pressing wither the
key or the  key. key.
|
Figure 16
 |
The desired list name has been placed on the screen. Now we will need to complete the command.
|
Figure 17
 |
We press   
 to complete the command.
Then we press to have the calculator perform the command.
|
Figure 18
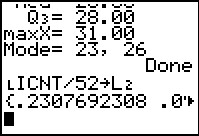 |
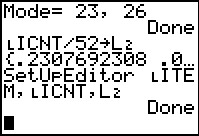
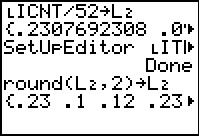
The result new values placed into L2. The first value,
0.2307692308, is the first value in LICNT, 12, divided by 52.
We cannot see more values on Figure 18, although we could have scrolled across to see them.
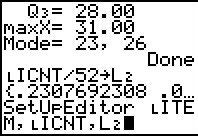
It would be easier to see them if we used the STAT Editor. We can set up the STAT Editor to display these
lists by using the SetUpEditor command. We find that command on the STAT menu,
which we open by pressing the  key. key.
|
Figure 19
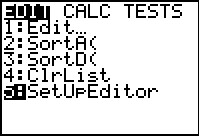 |
Figure 19 shows the STAT menu with item 5 hghlighted.
We select that item by pressing the key.
|
Figure 20
 |
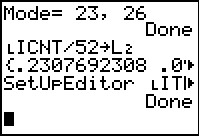
All that has happened is that we have pasted the SetUpEditor command onto the
main screen. Now we want to append the names of the lists that we want in the editor, separated
by commas.
|
Figure 21
 |
We return to the LIST menu, via ,
to find our desired names.In Figure 21 we have moved down the list to find the first name we want, LITEM.
We use the key to select that item.
|
Figure 22
 |
The result is to have the name LITEM pasted
to the end of the command we are building. We followed that by pressing he
 key to generate the comma at the end of the line.
[Please note that the display in Figure 21 was from a TI-84 Plus calculator
running software 2.55 with MathPrint turned on.
Therefore, the command is shown on one line and we can, on that calculator,
scroll back and forth. On older calcualtors and earlier software
the command would have been built across multiple lines.] key to generate the comma at the end of the line.
[Please note that the display in Figure 21 was from a TI-84 Plus calculator
running software 2.55 with MathPrint turned on.
Therefore, the command is shown on one line and we can, on that calculator,
scroll back and forth. On older calcualtors and earlier software
the command would have been built across multiple lines.]
|
Figure 22a
 |
This is the alternative image for Figure 22 from an older calculator or from one using the CLASSIC
display.
|
Figure 23
 |
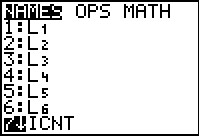
We return to the LIST menu to find the LICNT
name. Press to paste that highlighted name onto our command.
|
Figure 24
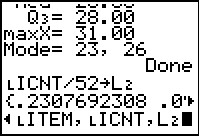 |
Figure 24 shows the command after we pasted LICNT
and followed that by
.
We still need to press to perform the command.
|
Figure 24a
 |
This is the alternative image for Figure 24 from an older calculator or from one using the CLASSSIC
display.
|
Figure 25
 |
From Figure 25 we can see that the command was indeed executed.
|
Figure 25a
 |
This is the alternative image for Figure 25 from an older calculator or from one using the CLASSSIC
display.
|
Figure 26
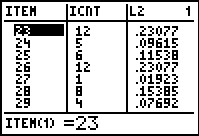 |
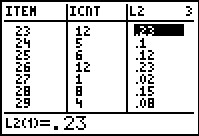
We return to the STAT menu (not shown) and press to
open the STAT Editor to get the display shown in Figure 27.
Here we see tht the value 26 appears 12 times in our original data and that 12 times represents .23077
of all the data.
|
Figure 27
 |
We can use the  key to scroll down to see even more of the relative frequency table. key to scroll down to see even more of the relative frequency table.
|
Figure 28
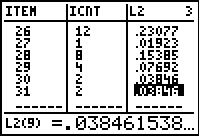 |
If we move the highlight to the third column, we see, as demonstrated in Figure 28, that although only
5 digits of the values are displayed on the table, the calculator actually carries many more than that.
Were we asked to produce the table rounded to 2 decimal places, then we could do this by
hand for each of the values in L2. On the other hand, we might as well
let the calculator do this for us.
|
Figure 29
 |
we will exit the STAT Editor by pressing
.
|
Figure 30
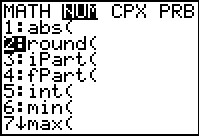 |
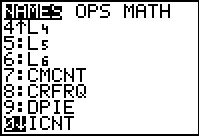
We open the MATH menu by pressing  , and then we move to the NUM
sub-menu via the key. The command we want is in postion 2 and we used the
key to move the highlight there. We select that item by pressing
. , and then we move to the NUM
sub-menu via the key. The command we want is in postion 2 and we used the
key to move the highlight there. We select that item by pressing
.
|
Figure 31
 |
Figure 31 has the pasted command round( which we followed by pressing
 .
Thus, we have created a command that tells the calculator to round each of the values in
L2 to 2 decimal places and to put those values back into
L2.
.
Thus, we have created a command that tells the calculator to round each of the values in
L2 to 2 decimal places and to put those values back into
L2.
We press to tell the calculator to perform the command.
|
Figure 32
 |
The resulting new list is displayed.
|
Figure 33
 |
We could use to return to the STAT menu (not shown),
and then to open the Stat Editor, with the result being the display in Figure 33.
|
Figure 34
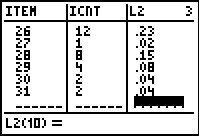 |
Using the key we can move down to see the end of the table.
Thus, our desired ralative frequency table is:
| Value |
Frequency | Relative
Frequecy |
| 23 | 12 | 0.23 |
| 24 | 5 | 0.10 |
| 25 | 6 | 0.12 |
| 26 | 12 | 0.23 |
| 27 | 1 | 0.02 |
| 28 | 8 | 0.15 |
| 29 | 4 | 0.08 |
| 30 | 2 | 0.04 |
| 31 | 2 | 0.04 |
|
|
Figure 35
|
Figure 35 merely recalls Figure 13. As noted above, this screen image
is from a run of Version 2 of the COLLATE2 program. Version 2
generates even more lists than did the earlier versions. In particular,
version 2 of the program generates LRFREQ,
a list of the relative frequencies associated with the data in LICNT.
To verify this, merely compare Figure 35 with the contents of Figure 26.
Therefore, we really could have stopped this right at Figure 13,
relying on the program to generate the correct relative frequencies.
|